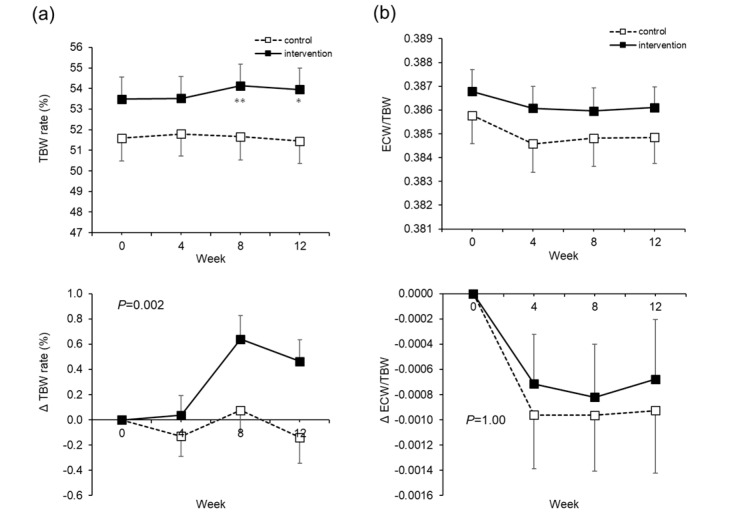
Figure 3.
Total body water (TBW) rate and extra-cellular water (ECW)/TBW. The actual level (upper) and changes (lower) in the TBW rates (a). The actual level (upper) and changes (lower) in ECW/TBW (b). The dotted line is the control group. The solid line is the intervention group. Mean ± SEM. The P value is the difference between the groups for the change from Week 0 to Week 12. Two-way analysis of variance was performed. Paired t-test adjusted by the Bonferroni method was performed for intragroup comparisons from Week 0. * p < 0.05, ** p < 0.001.

