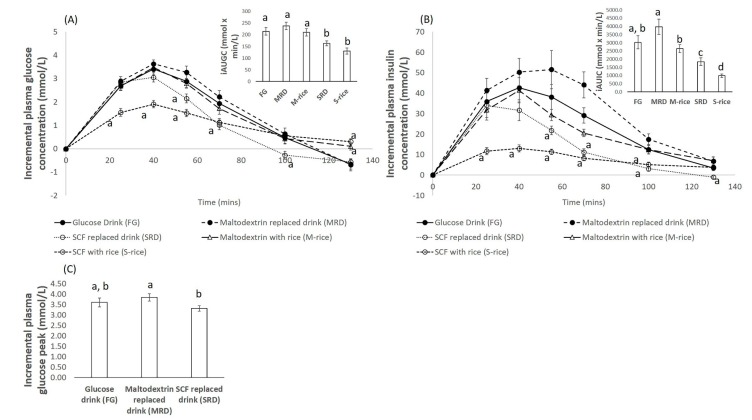
Figure 1.
(A) Incremental plasma glucose concentration over time of all the five treatments along with the bar plot of the mean incremental area under the curve values of glucose (iAUGC) (130) of the five different treatments: The error bars represent the standard error of the mean (SEM). Each time point was compared with the glucose drink as the reference. (B) Incremental plasma insulin concentration over time of all the five treatments along with the bar plot of the mean iAUIC (130) of the five different treatments: The error bars represent the SEM. Each time point was compared with the glucose drink as the reference. (C) Bar plot of the mean incremental plasma glucose peak of the three liquid treatments. The error bars indicate the SEM. For all plots, different alphabets represent statistically different mean values.

