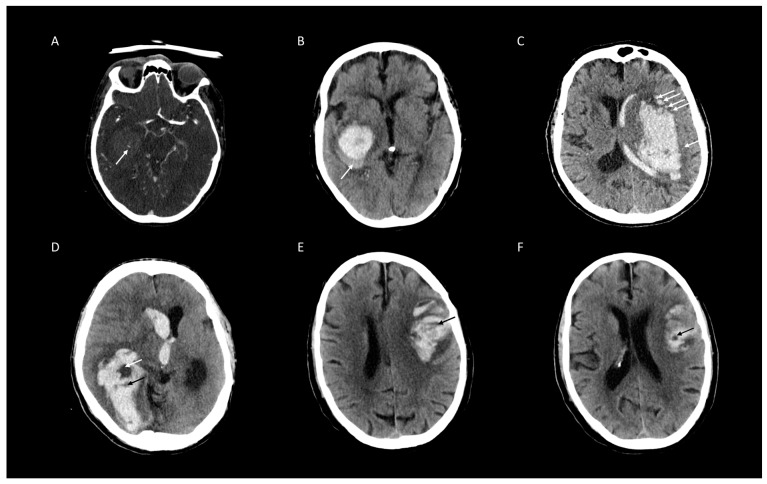
Figure 3.
Representative examples of agreed ratings of four non-contrast computed tomographic (NCCT) markers and Spot Sign (SS) on CT-angiography (CTA) for intracerebral hemorrhage expansion. (A) SS on CTA (white arrow). (B) Blend Sign (white arrow). (C) Island sign (all white arrows). (D) Black Hole Sign (white arrow), Hypodensities (black arrow). (E) Hypodensities (black arrow). (F) Black Hole Sign (white arrow).

