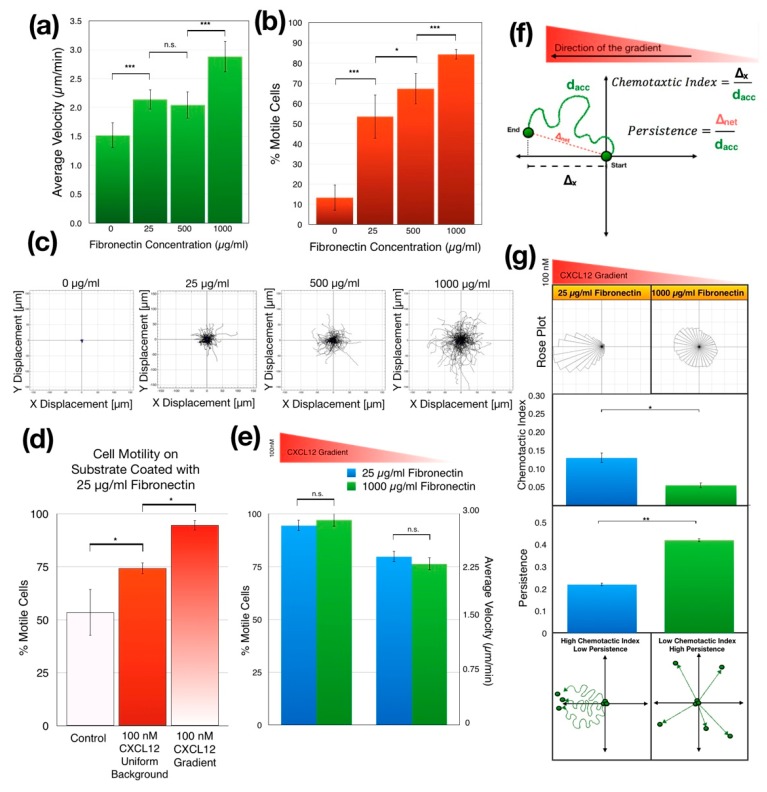
Figure 4.
The effect of fibronectin concentration on Jurkat cell chemotaxis. (a) During random motion, the average speed of the migrating cells increased as the fibronectin concentration increased (p < 0.0001 by one-way ANOVA, ** p < 0.01, *** p < 0.001 by post hoc two-tailed unpaired student’s t-test with Bonferroni correction). (b) Also, during random motion, the percentage of motile cells increased as the fibronectin concentration increased (p < 0.0001 by one-way ANOVA, ** p < 0.01, *** p < 0.001 by post hoc two-tailed unpaired student’s t-test with Bonferroni correction). (c) Spider motility plots of randomly migrating Jurkat cells in microchambers coated with 0, 25, 500 and 1000 µg/mL of fibronectin, respectively. As the fibronectin concentration increased, cells spread more while maintaining their mass center at the origin (location of final mass center is shown as a blue dot). (d) Comparison of the percentage of motile cells in culture medium, in uniform 100-nM CXCL12 background and in 100-nM CXCL12 gradient in the microfluidic chambers coated with 25 µg/mL of fibronectin. (p < 0.0001 by one-way ANOVA, * p < 0.05 by post hoc two-tailed unpaired student’s t-test with Bonferroni correction). (e) In CXCL12 gradients, the motility of the cells appears to be independent of fibronectin concentration. Unlike Figure 4c,d, the change in fibronectin concentrations does not seem to alter the percentage of the motile cells nor the average migration speed when there is a chemokine gradient (p > 0.05 by two-tailed unpaired student’s t-test). (f) Schematic indicating our quantitative analysis approach for Jurkat cell motility in CXCL12 concentration gradient. (g) Jurkat cell chemotaxis in the gradient chamber coated with 25 µg/mL (referred to here as low concentration) and 1000 µg/mL (referred to here as high concentration) fibronectin. As the fibronectin concentration increased, the chemotactic index decreased (shown in the rose plots at the top) while the persistence increased (shown in the bar graphs at the middle). At high fibronectin concentrations Jurkat cells tend to migrate in a specific direction (high persistence), but this direction becomes independent of the direction of the chemokine gradient (low chemotactic index). This observation has been represented in the bottom schematics (** p < 0.01, * p < 0.05 by two-tailed unpaired student’s t-test). Data are presented as mean ± SD.

