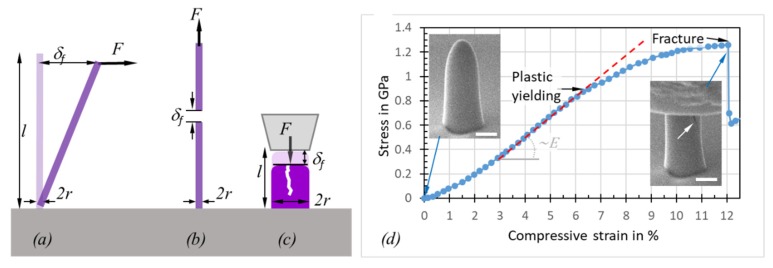
Figure 6.
Approaches to measure the yield strength (plasticity) and the fracture strength of FEBID and FIBID materials. (a) Bending (one end pinned), (b) tensile straining, and (c) nanocompression with a flat blunt indenter. An example of a stress–strain diagram obtained from a nanocompression experiment with an FEBID pillar is shown in (d). Plasticity and fracture onsets are indicated by arrows; see also the crack propagating into the pillar. Circular cross-sections enable simple mathematics (see text); yet more complex 3D architectures can be also measured according to (a)–(c).

