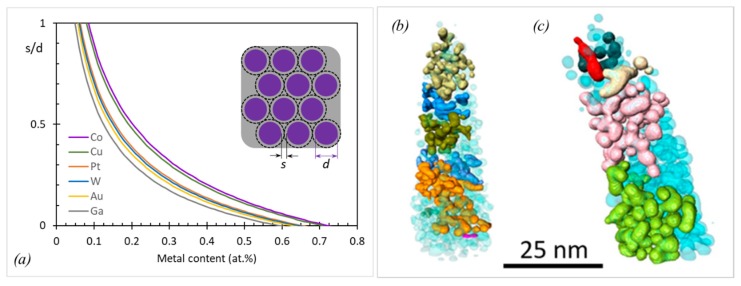
Figure 15.
(a) The average nanoparticle distance s normalized to their size d versus the metal content for five metals. For , the full percolation metal threshold is reached. The inset shows the corresponding idealized close packed geometry of metal nanoparticles (purple) with a carbon shell (gray, dotted line). The carbon matrix density was set to 2 g/cm3. (b) and (c) show 3D reconstructions from Pt-C nanopillars, which were derived from high-resolution TEM tomography. (b) shows the as-grown FEBID with 30 keV/21 pA, with large Pt nanocrystals becoming evident and revealing slightly percolated characteristics, as indicated by the different colors. After high-dose e-beam curing at 30 keV/150 pA, the grain growth (average by 25 rel.%) is clearly evident, while the partial percolation characteristics remain, as shown by the different colors in (c). Images have been adapted from reference [102].

