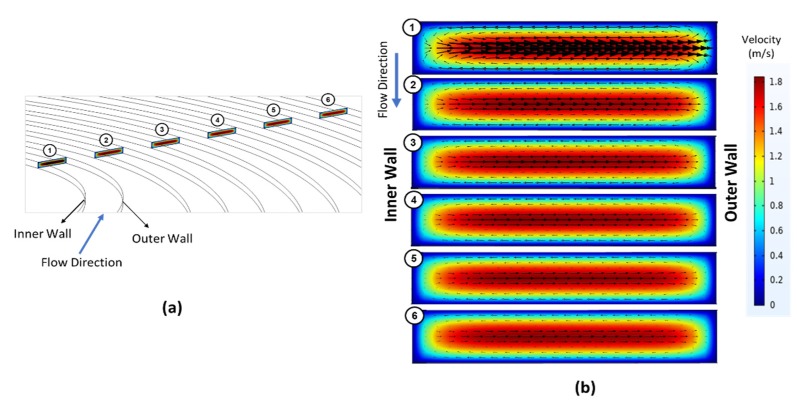
Figure 3.
(a) Six different cut-plane positions labeled starting from the inner loop along the primary flow direction, and (b) a closer look at the vectoral variation of lateral velocity distributions over the colored velocity profile of the primary flow at six different cross-sections throughout the channel. The cross-sectional velocity profiles were retrieved form COMSOL Multiphysics simulation results of Case 1 at volumetric flow rate of 3 mL/min.

