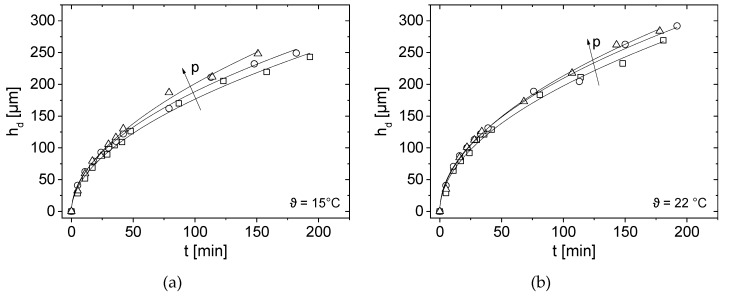
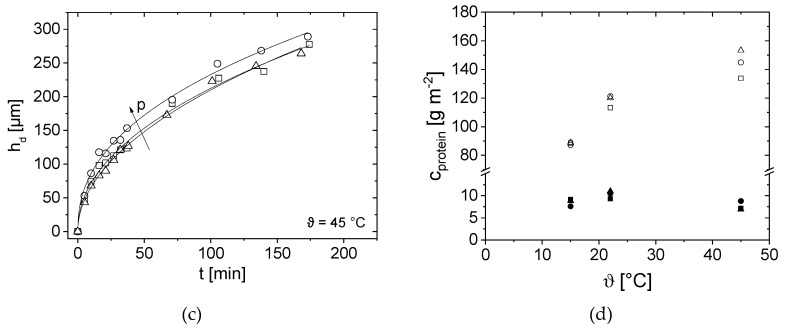
Figure 6.
Deposit height hd at z = 29 cm as a function of filtration time t for (a) ϑ = 15 °C (b) ϑ = 22 °C and (c) ϑ = 45 °C. A small difference in deposit height was observed especially at large filtration times for p = 0.25 bar (squares), p = 0.75 bar (circles) and p = 1.25 bar (triangles). The deposit height was empirically modelled by hd(t) tb,local (lines). (d) Protein concentration cprotein on the membrane surface as a function of filtration temperature ϑ for p = 0.25 bar (squares), p = 0.75 bar (circles) and p = 1.25 bar (triangles). Open symbols represent caseins and closed whey proteins.


