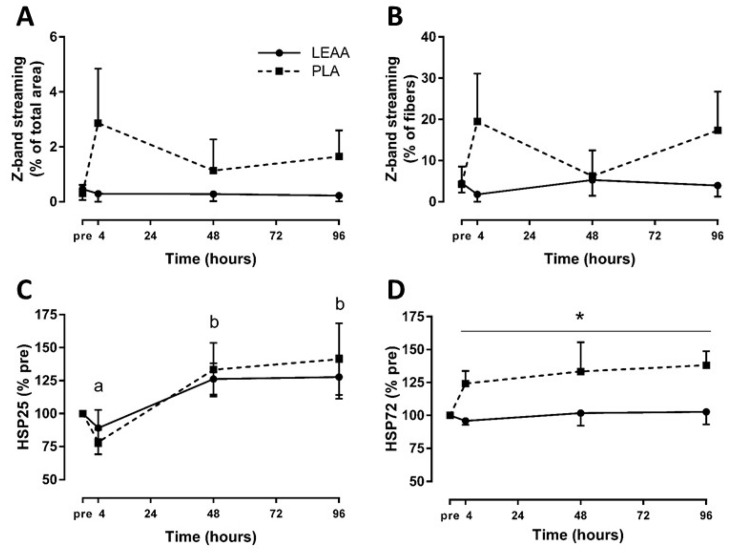
Figure 5.
Mean (± SEM) Z-band streaming percentage area (A), percentage of fibers with Z-band streaming (B), and muscle heat shock protein 25 (C) and 72 (D) after resistance exercise in response to LEAA or placebo consumption. * Significant effect of group (p < 0.05). Time points with different letters are significantly different from each other (main effect for time, p < 0.05). Pre, pre-exercise; PLA, placebo.

