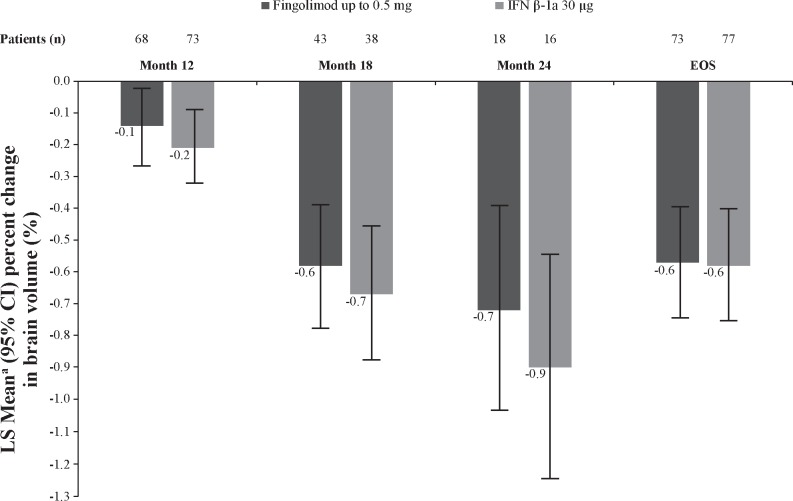
Figure 5.
Percent change in brain volume (re-baselined from 6 months) by time point (FAS). Data are expressed as adjusted mean±95% CI. n, number of patients included in each analysis. EOS is defined as the last assessment taken on or before the final study phase visit date. aObtained from fitting an ANCOVA model adjusted for treatment, region, pubertal status (the stratification factor in IVRS) and 6-month baseline normalised brain volume as covariates. ANCOVA, analysis of covariance; EOS, end of the study; FAS, full analysis set; IFN, interferon; IVRS, interactive voice response system.

