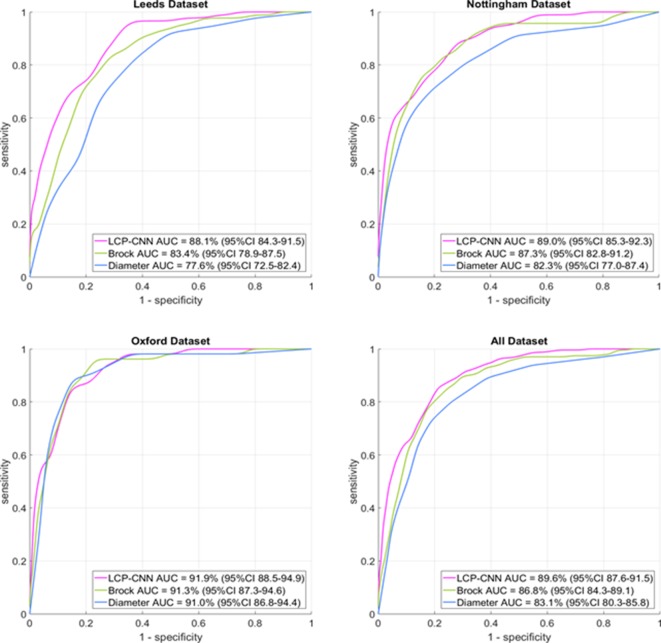
Figure 2.
Receiver operating characteristic curves for the three centres and the full dataset. For each curve, the distance it follows along the upper horizontal axis is directly related to its ability to rule out benign nodules, and in all plots, the magenta curve for the LCP-CNN dominates that upper part of the plot. The LCP-CNN also approaches the y-axis at a higher sensitivity value than the Brock or diameter curves, indicating that at the high-specificity end (ie, ruling in cancers rather than ruling out benign nodules), the LCP-CNN also offers better stratification than the two simpler methods. AUC, area under the cuve; LCP-CNN, lung cancer prediction convolutional neural network.

