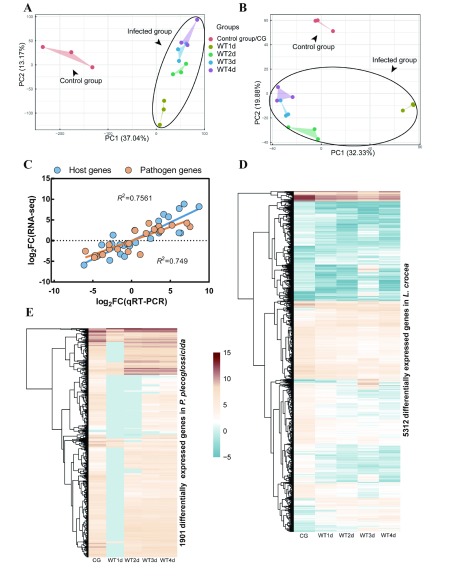
2. Transcriptional profiles of L. crocea and P. plecoglossicida in infected spleens .
A: PCA clustering of full transcriptional profiles of L. crocea. B: PCA clustering of full transcriptional profiles of P. plecoglossicida. C: Validation of RNA-seq data by qRT-PCR. Blue indicates host, orange indicates pathogen, and R-square is marked. D: Hierarchical clustering of major classes of differentially expressed mRNAs (DEMs, P<0.01, log2 fold-change (Log2FC)≥2) in L. crocea transcriptomes. E: Hierarchical clustering of major classes of DEMs (P<0.01, log2 fold-change (Log2FC)≥2) in P. plecoglossicida transcriptomes. Relative expression levels of each transcript (rows) in each sample (column) are shown. FPKM was log2-transformed and then median-centered by transcript. CG: Control group; WT1d: Infected group sampled at 1 dpi; WT2d: Infected group sampled at 2 dpi, and so on. Same below.

