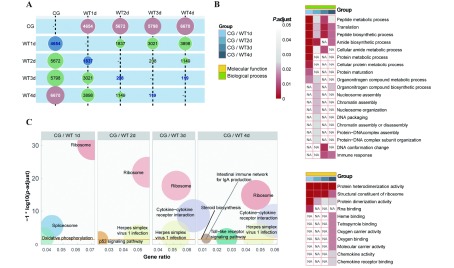
3. Differentially expressed mRNA (DEM) analysis of L. crocea infected by P. plecoglossicida .
A: Numbers of DEMs between time points in host. Most different time point across all comparisons (i.e., within a column) is shown in red, most similar time point across all comparisons (i.e., within a column) is shown in blue. B: Heat map of GO enrichment analyses. Shade of color represents size of P-adjusted value, “NA” indicates not significantly enriched in this comparison group. C: KEGG enrichment analysis. Size of circle represents size of enriched gene number, each color represents a pathway.

