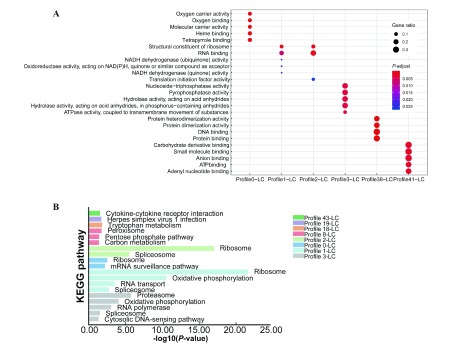
5. STEM profile enrichment analysis of L. crocea .
A: Top five GO molecular function (MF) terms for six profiles. Size of circle represents number of enriched genes, each color indicates significance. B: KEGG pathway enrichment analysis. Different colors are used to represent different profiles, and height of bar graph indicates significance.

