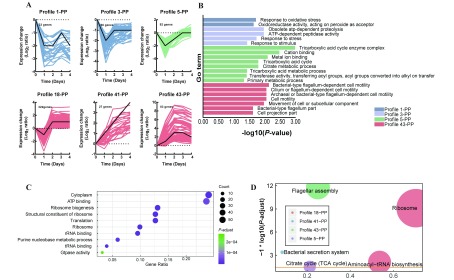
7. STEM analysis for P. plecoglossicida .
A: Six major profiles of gene expression. Top left-hand corner indicates number of DEMs belonging to profile. Lower left-hand corner shows P-value of profile. Colored lines represent DEMs. X-axis represents days after P. plecoglossicida inoculation (dpi). Y-axes represent log2-fold-change in gene expression between treatments. B: GO enrichment analysis of profile 43-PP, 5-PP, 3-PP, and 1-PP. C: Top ten GO terms of profile 18-PP. Size of circle represents quantity of enriched genes, and each color indicates significance. D: KEGG pathway enrichment analysis. Size of circle represents size of enriched gene number, each color represents different groups.

