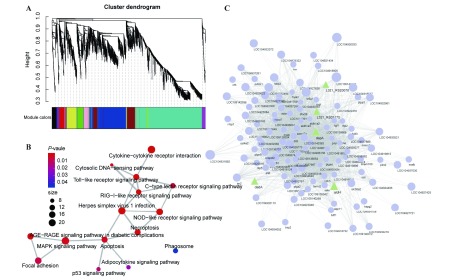
8. Weighted Gene Co-expression Network Analysis (WGCNA) of transcriptional changes in L. crocea and P. plecoglossicida .
A: L. crocea time-resolved transcriptome WGCNA cluster map. B: KEGG enrichment analysis for yellow module. Size of circle represents number of genes in pathway, color indicates significance, and connected pathways represent genes within it. C: Correlation network of genes in yellow module, L. crocea and P. plecoglossicida genes with edge weights greater than 0.35. Dot size represents KME values. L. crocea genes are shown in purple, P. plecoglossicida genes are shown in green.

