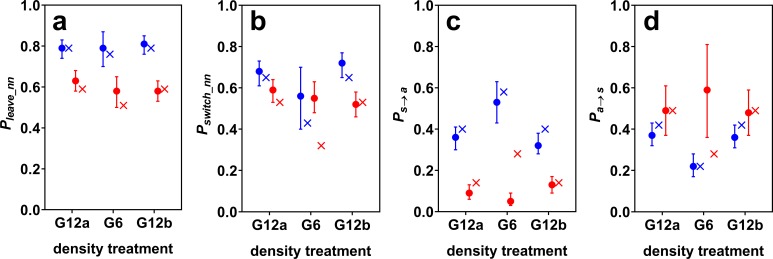
Figure 2. Estimated model probabilities (plus 95% confidence intervals) for cave (blue) and surface mollies (red).
Shown are (A) probabilities of leaving the current nearest neighbour (Pleave_nn), (B) of switching social partners within the period of social time (Pswitch_nn), (C) of discontinuing social contact in general (Ps→a), and (D) of discontinuing being alone (Pa→s). The probabilities resulting from a random walk simulation are marked by x’s. The parameters of the simulation were chosen such that it roughly reproduced the observed model probabilities of the groups of 12 fish (see main text).

