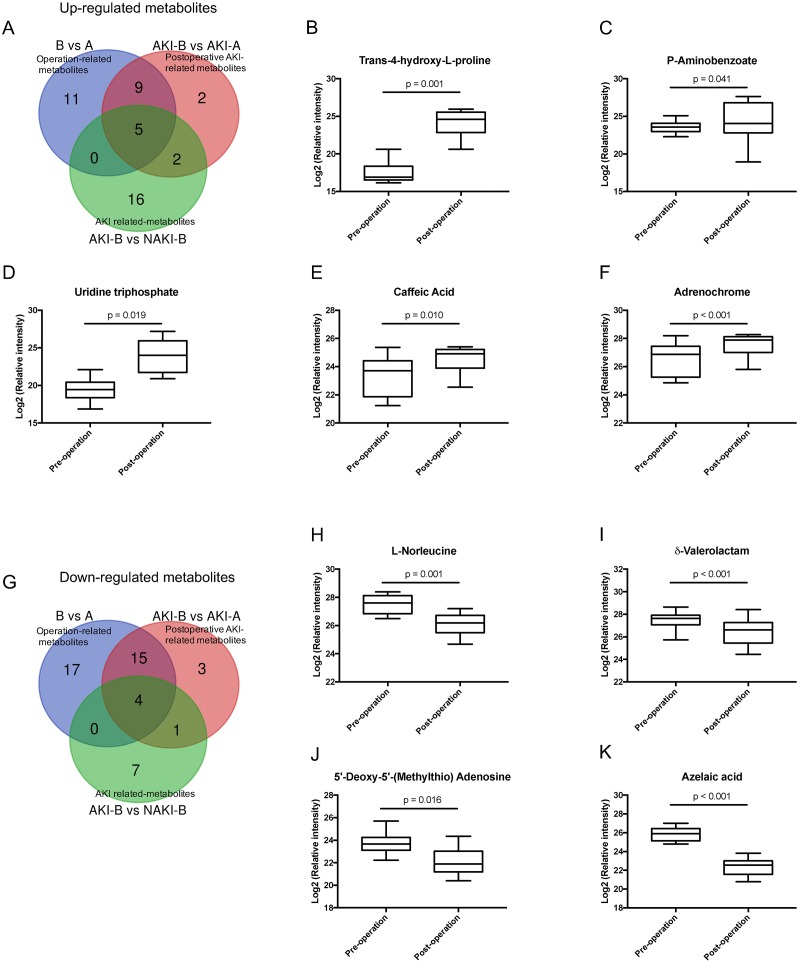
Figure 5. Venn analysis identified metabolites associated with postoperative AKI in DM.
(A) Venn diagram of the up-regulated overlapping metabolites from three pairs data (B vs. A, AKI-B vs. AKI-A and AKI-B vs. NAKI-B); (B–F) The relative intensities of the five up-regulated overlapping metabolites before and after CABG; (G) Venn diagram of the down-regulated overlapping metabolites from three pairs data (B vs. A, AKI-B vs. AKI-A and AKI-B vs. NAKI-B); (H–K) The relative intensities of the four down-regulated overlapping metabolites before and after CABG. Abbreviations: CABG, coronary artery bypass grafting; A, preoperative sample; B, postoperative sample.

