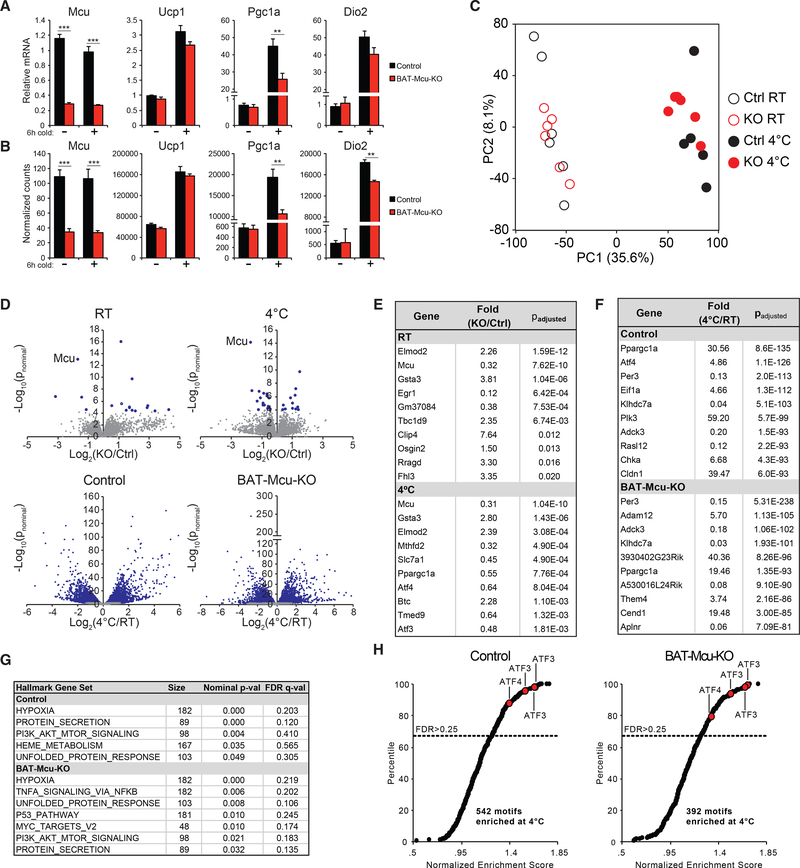
Figure 3. Transcriptional Response to Cold Exposure.
(A) qPCR of MCU and cold-induced transcripts in brown fat (n = 5–6 mice per group).
(B) Normalized counts of transcripts in (A) measured by RNA-seq.
(C) Principal component analysis of gene expression data.
(D) Volcano plots comparing —Cre with +Cre gene expression at two temperatures, and comparing RT with 4°C gene expression in both genotypes (blue points denote transcripts achieving an adjusted p value < 0.05).
(E) Top 10 genes enriched by genotype at either RT or 4°C (genes ranked by adjusted p value).
(F) Top 10 genes enriched by temperature in either —Cre or +Cre mice.
(G) MSigDB hallmark genesets enriched at 4°C in —Cre or +Cre mice.
(H) DNA motifs enriched at 4°C in —Cre or +Cre mice. Red points indicate motifs annotated as ATF3 or ATF4 targets. Genes were rank ordered using the Student’s t test metric. Samples were permuted 1,000 times to evaluate significance.
Results are reported as mean + SEM. Statistical significance is indicated as *p < 0.05, **p < 0.01, ***p < 0.001 (Student’s t test).

