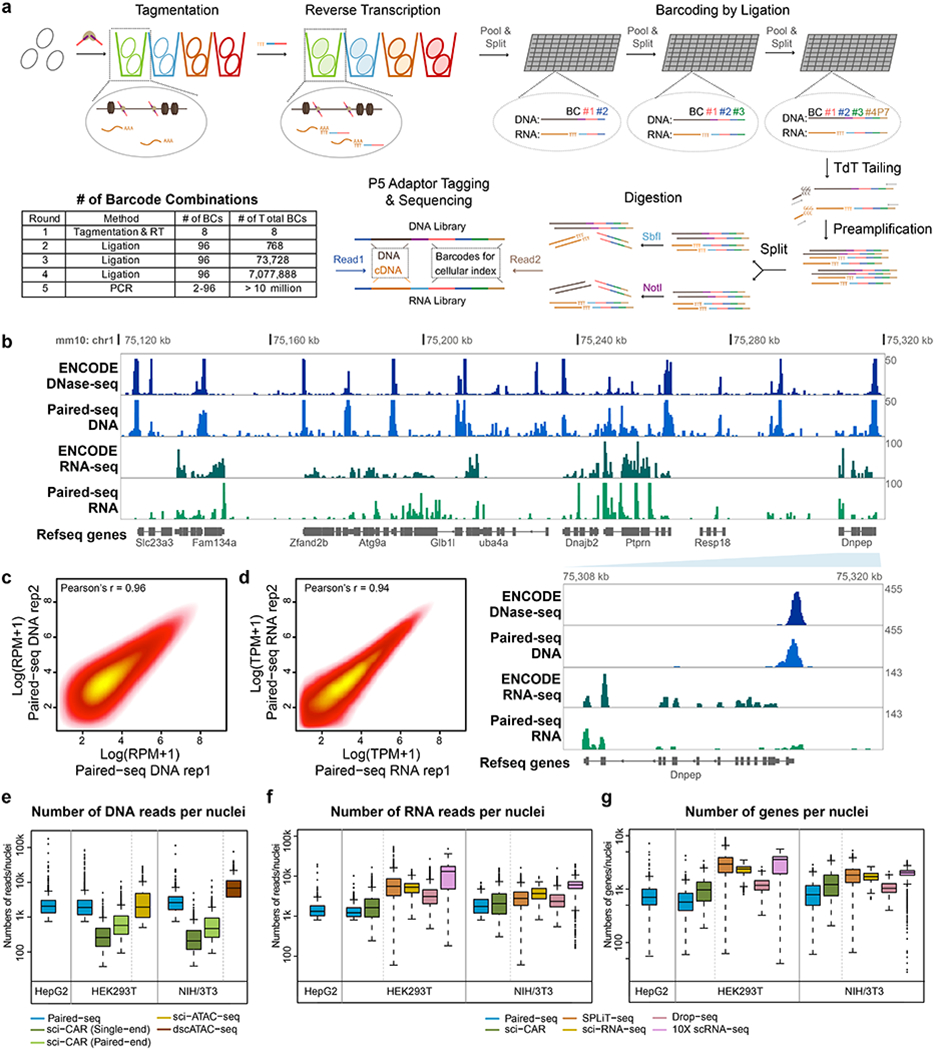
Fig. 1 |. Paired-seq enables simultaneous profiling of accessible chromatin and gene expression in millions of single cells.

a, Schematic of Paired-seq workflow. Paired-seq includes five rounds of combinatorial barcoding that enables labeling of millions of cells in one single experiment. In the first round, cells are subject to Tn5 transposition followed by reverse transcription in separate tubes. This is followed by three rounds of ligation-mediated barcoding carried out in 96-well plates using a split and pool strategy. In the final round, DNA barcode tags are first added to genomic DNA and cDNA by TdT-assisted DNA tailing. The resulting DNA is PCR amplified with different primers, and subject to restriction digestion to produce separate libraries for detecting chromatin accessibility and RNA transcripts. b, A representative genome browser view of Paired-seq data from NIH/3T3 cells (Mouse genome assembly mm10). Tracks of DNase-seq and RNA-seq data downloaded from ENCODE data portal are also shown. Proportions of DNA and RNA reads in both libraries are shown. A zoomed-in view of Dnpep gene locus were shown in the bottom right panel, indicated by the light blue wedge. Scatter plots show the correlation of read counts from two technical replicates of Paired-seq DNA profiles (c) or RNA profiles (d). Boxplots show (e) the number of uniquely mapped DNA reads, (f) the number of uniquely RNA mapped reads and (g) the number of genes captured per cell from either HEK293T, HepG2 and NIH/3T3 cells. As comparison, the numbers of reads or genes captured per cell by sci-CAR40 (GSE117089), sci-ATAC-seq9 (GSE67446), dscATAC-seq44 (GSE123581), SPLiT-seq42 (GSE110823), sci-RNA-seq45 (GSE98561), Drop-seq21 (GSE63269) and 10X scRNA-seq (1k_hgmm_v3_nextgem dataset) from the same cell types are also shown. All datasets were sequenced or down-sampled to ~15k raw reads per cell. In boxplots center lines indicate the median, box limits indicate the first and third quartiles and whiskers indicate 1.5x interquartile range (IQR). Source data for panels e-g are available online; sample sizes are provided there.
