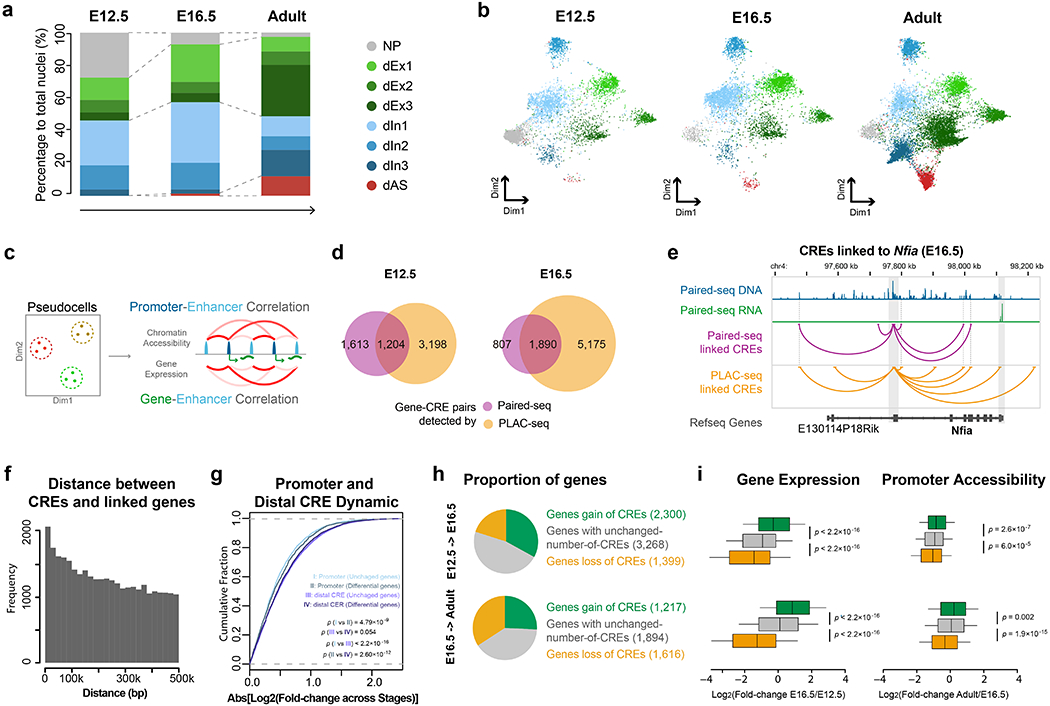
Fig. 3 |. Paired-seq links candidate cis-regulatory elements to their putative target genes.

Clustering of single nuclei from mouse E12.5 and E16.5 forebrain samples revealed eight distinct major groups: neuronal progenitors (NP), glutamatergic neural cells (dEx1, dEx2, dEx3), GABAergic neural cells (dIn1, dIn2 and dIn3), and astrocytes (dAS) according to the maker genes (Extended Data Fig. 3c.) a, Stacked bar charts showing the percentages of different cell clusters identified from E12.5 forebrain, E16.5 forebrain and adult cerebral cortex. b, UMAP plot shows the different representation of cell clusters from E12.5 forebrain, E16.5 forebrain and adult cerebral cortex. c, Schematics for identifying potential gene-CRE pairs. d, Venn-diagram showing the fraction of gene-CRE pairs identified from Paired-seq and H3K4me3 PLAC-seq data from mouse E12.5 and E16.5 forebrains. e, Genome browser view of the Nfia locus. Gene-CRE pairs identified by Paired-seq and PLAC-seq data from E16.5 mouse forebrain samples are shown in purple and yellow, respectively. Promoter region and 3’UTR of Nfia gene are highlighted in grey. f, Histogram of the genomic distances between the candidate CREs and their linked genes. g, Cumulative distribution function plot of promoter and CRE dynamics. Genes were grouped into unchanged genes and differentially expressed genes according to the fold-change of the expression level between E12.5 and E16.5 (Log2[Fold-change]>2). The x-axis is the absolute value of fold-change of promoter or CRE accessibility between the two stages. P-value, two sided K-S test, nI and III = 22,923 unchanged genes and nII and IV = 1,776 differentially expressed genes. h, Pie-charts showing genes classified according to changes of candidate CREs linked to them: genes with a gain of linked candidate CREs between stages (Log2[fold-change] > 3), genes with unchanged number of CREs (−1 < Log2[fold-change] < 1) and genes with a loss of linked candidate CREs (Log2[fold-change] < −3). i, Boxplots showing the fold-change of expression and promoter accessibility of genes in the 3 groups. P-value, two-sided K-S test. In boxplots center lines indicate the median, box limits indicate the first and third quartiles and whiskers indicate 1.5x interquartile range (IQR). The sample size of each group is provided in h. Source data for panels a and b are available online.
