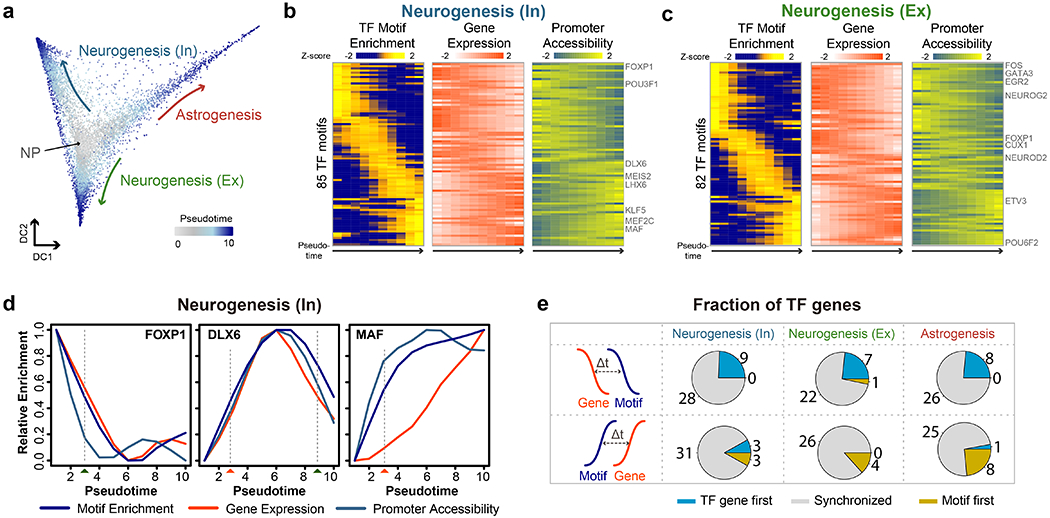
Fig.4 |. Analysis of cellular trajectory in the developing mouse forebrain.

a, Diffusion map showing the trajectories of astrogenesis and neurogenesis. b, c, Heatmaps show the ordering of the chromvAR TF motif enrichments during neurogenesis towards (b) GABAergic neurons and (c) glutamatergic neurons. The relative expression and promoter accessibility of corresponding TF genes are also shown. d, Line plots showing the relative enrichment of TF motifs, gene expression and promoter accessibility for FOXP1, DLX6 and MAF according to the diffusion pesudotime for neurogenesis of GABAergic neurons. The estimated time-of-gain and time-of-loss of TF motif enrichment in open chromatin are indicated by red and green rectangles below. e, Pie-charts of the fraction of TFs showing upregulation of TF genes before (TF gene first), synchronized with, or after (Motif first) the detection of TF motif enrichment in accessible chromatin during neurogenesis towards GABAergic neurons, glutamatergic neurons and astrogenesis. Source data for panels b-d are available online.
