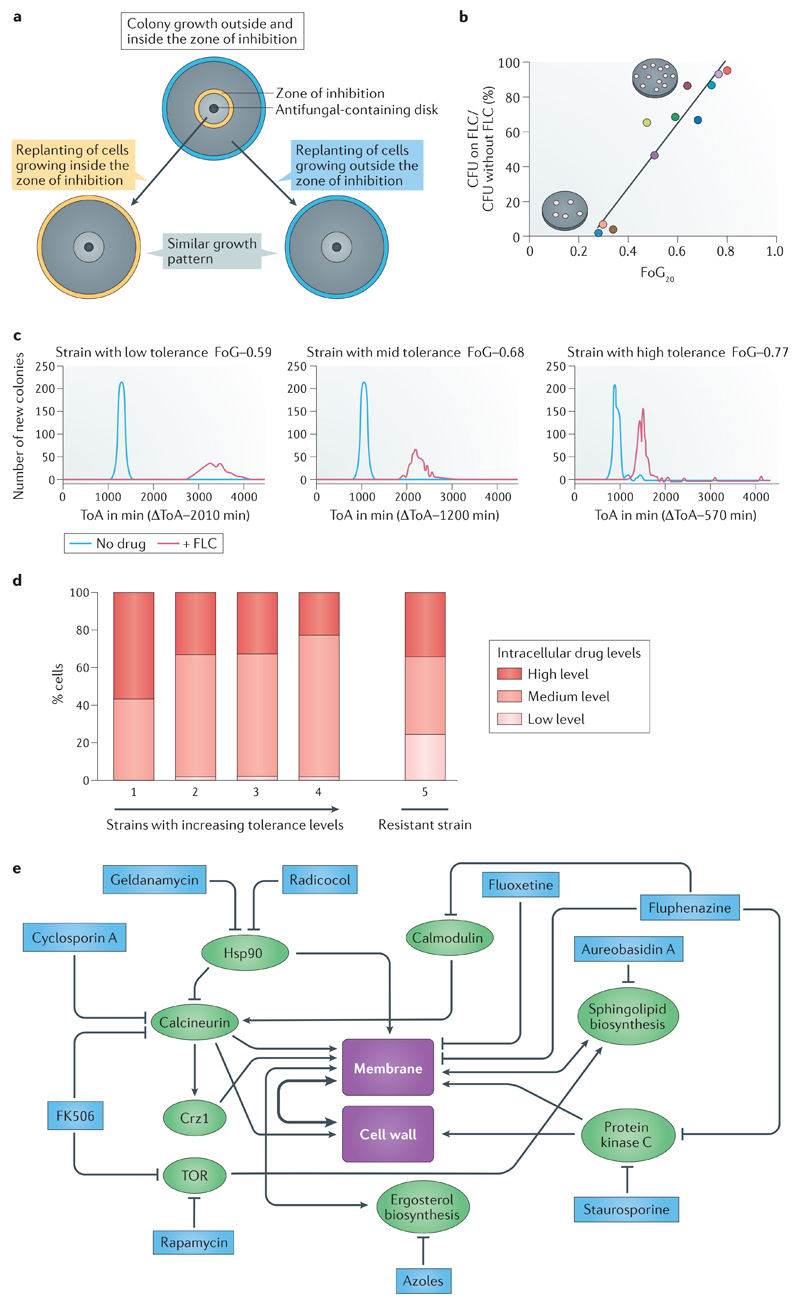
Figure 1. Phenotypic characteristics and pathways required for antifungal tolerance.
A. Tolerance is a phenotypic property of a given isolate that differs between different clinical isolates. The subpopulation of cells in the tolerant state (characterized by slow growth within the zone of inhibition in disk diffusion assays (Box 1)) is isogenic to cells in the non-tolerant state (the whole population of cells that grow outside the zone of inhibition). A disk diffusion assay with a single drug disk in the center of a petri plate is shown; the zone of inhibition border is indicated in yellow (top panel). When cells from this plate were spread on new plates with the same amount of drug, similar patterns of growth are observed for tolerant cells taken from within the zone of inhibition (bottom left) and non-tolerant cells taken from outside the zone of inhibition (between the yellow and cyan circles), indicating cells retain a similar potential to give rise to both types of subpopulations (tolerant and non-tolerant) in similar ratios. The radius (RAD) of the zone of inhibition, used to determine the minimum inhibitory concentration (MIC), and the fraction of growth (FoG) used to measure tolerance (Box 1), are similar in all three plates (not indicated). Similar results also are obtained with broth microdilution assays (not shown)9.
B. Tolerance (measured as FoG at 20% drug inhibition (FoG20) (see Box 1)) correlates with the proportion of colonies that appear at fluconazole (FLC) concentrations above the MIC (relative to total colonies growing in the absence of drug). Different strains are represented by different coloured dots.
C. The time required for cells to appear as visible colonies on a petri plate containing drug (time of colony appearance (ToA)) is shorter for isolates with high tolerance levels than for isolates with lower tolerance levels. Shown is a comparison between 3 clinical isolates that exhibit different levels of tolerance (indicated by the different FoG levels). The average difference between the ToA on plates containing an inhibitory drug concentration (red lines) and the ToA on plates without a drug (blue lines), ΔToA, inversely correlates with the level of tolerance (FoG levels). The growth rates of visible colonies and the final colony sizes are largely independent of tolerance levels.
D. Strains with low and increasing levels of tolerance are composed of cells with different amounts of intracellular azole drug. Shown are four susceptible strains, with increasing levels of tolerance (from left to right), and one resistant strain (far right). Among the susceptible strains, the proportion of cells with high amounts of intracellular drug decreases with increasing tolerance levels. The proportion of cells with high (red), intermediate (orange) and low intracellular drug concentrations of a fluorescent azole antifungal (Cy5-azole) drug differ from each other by an order of magnitude as measured by flow cytometry9. The resistant strain has a much larger proportion of cells with low intracellular drug concentration.
E. Studies using mutants and inhibitors reveal general stress pathways that affect tolerance. Proteins and pathways implicated in tolerance (green) and compounds that inhibit those pathways and also inhibit tolerance (blue) seem to converge on the cellular processes involved in membrane integrity and/or cell wall function. Some of the inhibitors affect more than one gene or pathway. For example, heat-shock protein 90 (Hsp90) inhibits calcineurin, which in turn activates Crz1, a transcription factor required for membrane integrity as well for tolerance26,25,96. Fluphenazine, an adjuvant drug that inhibits tolerance and renders fluconazole cidal9, is an inhibitor of both protein kinase C, which has been implicated in fluconazole tolerance22, and calmodulin, which is a regulator of calcineurin activity and ultimately, membrane and cell wall integrity97. This implies that tolerance relies on one or both of these central regulators for cell viability in the presence of fluconazole. Noteworthy, published studies investigating drug responses are difficult to interpret because the terms resistance and tolerance have been used interchangeably. Nonetheless, most published data is consistent with the notion that the regulation of both membrane integrity and cell wall function are important for tolerance. Figures 1a-d are modified from Ref.9. Figure 1e is based on data from Ref. 9 together with many other studies (Reviewed in98).

