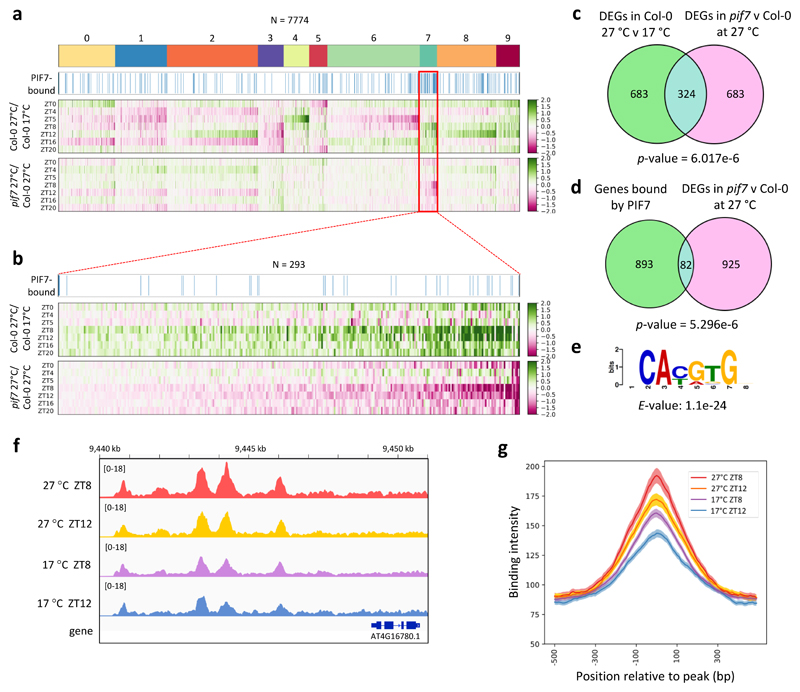
Figure 3. PIF7 directly activates the warm temperature transcriptome in response to daytime thermal cycles.
a Clustering of RNA-seq data of Col-0 and pif7-1 seedlings grown in LD with a 27 °C midday (ZT4-ZT12) compared to Col-0 seedlings grown at 17 °C. Expression profiles of differentially expressed genes (DEGs) in Col-0 at 27 °C compared to 17 °C are shown, with profiles of the same genes in pif7-1 compared to Col-0 at 27 °C slotted in below. Blue bars indicate genes bound by PIF7-MYC in ChIP-seq experiments.
b Zoom-in of cluster 7 shown in (a).
c, d Venn diagrams showing the overlap between genes regulated by temperature and misregulated in pif7-1 (c) and the overlap between genes bound by PIF7-MYC and misregulated in pif7-1 (d). p-values were obtained by Fisher’s exact test for the independence of the two gene sets in comparison with the genomic background (n = 33554).
e De-novo motif under PIF7-MYC ChIP-seq peaks identified using MEME. E-value was calculated as the product of p-values using the MEME package 71.
f IGV browser view of PIF7-MYC binding in the ATHB2 promoter.
g Binding intensity profiles for PIF7-MYC ChIP-seq peaks at ZT8 and ZT12, 17 °C and 27 °C, respectively.

