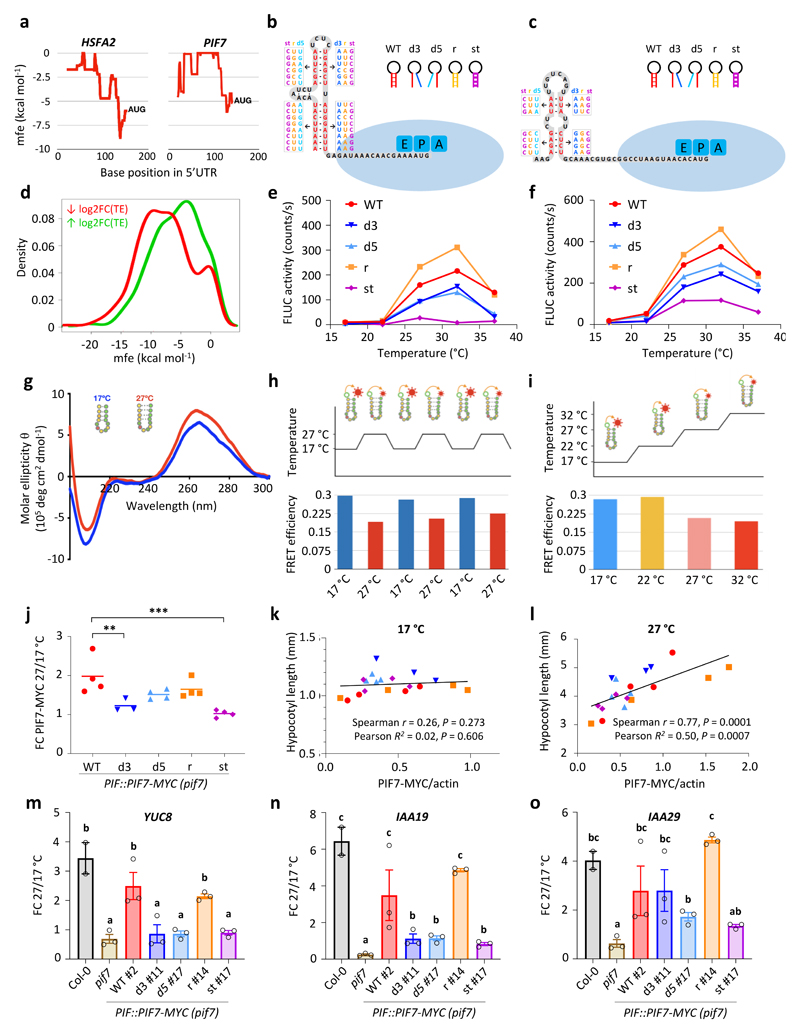
Figure 4. Thermosensitive hairpin structures in the HSFA2 and PIF7 5’UTRs enhance translation in response to warm temperature.
a Minimal free energy (mfe) plot of the HSFA2 and PIF7 5’UTRs using a 40 nt sliding window.
b, c Predicted hairpin structures in the 5’ UTR of HSFA2 (b) and PIF7 (c); mutated sequences used in in vitro studies (see below for details) are indicated in boxes.
d Density plot of lowest mfe in the 5’ UTRs of genes with reduced and enhanced TE.
e, f In vitro translation of HSFA2 (e) and PIF7 (f) 5’UTR hairpin::firefly luciferase (FLUC) RNA fusions at different temperatures, using FLUC activity as read-out. Wild-type (WT), 3’ and 5’ disrupted (d3, d5), reconstituted (r) and stabilised (st) hairpin sequences were tested. Data points represent the mean of two technical replicates. The experiments were repeated three times with similar results.
g Circular dichroism spectrum of an RNA molecule containing the putative PIF7 5’ UTR hairpin sequence shown in (c) at 17 °C and 27 °C. The experiment was repeated once with similar results.
h, i FRET efficiencies of an RNA molecule containing the putative PIF7 5’UTR hairpin sequence shown in (c) tagged with 6-carboxyfluorescein and 6-carboxytetramethylrhodamine fluorophores; FRET was measured during multiple shifts between 17 °C and 27 °C (h) and over a temperature gradient from 17°C to 32°C (i).
j-l Fold change (FC) in PIF7-MYC protein levels between 27 °C and 17 °C (j) as well as correlations between PIF7-MYC levels and hypocotyl length at 17 °C (k) and 27 °C (l) at ZT12 in independent PIF7::PIF7-MYC (pif7-1) transgenic lines harbouring the different hairpin mutants depicted in (c). Asterisks indicate significant differences to WT (One-way ANOVA followed by two-sided Dunnett’s test, * p < 0.05, ** p < 0.01, *** p < 0.001). Lines in j represent the mean in FC obtained from multiple independent transgenic lines (n = 4 except for d3 with n = 3). Data points in k and l represent mean hypocotyl length (n = 20) plotted against mean protein level (n = 3) for each transgenic line. The experiment was repeated once with similar results.
m-o Fold change in YUC8 (m), IAA19 (n) and IAA29 (o) transcript levels between 27 °C and 17 °C at ZT12 in the indicated genotypes. Bars represent the mean, error bars represent the SEM (n = 3). Letters indicate significance groups; samples with the same letters are not significantly different (One-way ANOVA followed by two-sided Tukey test, p < 0.05). The experiment was repeated once with similar results.

