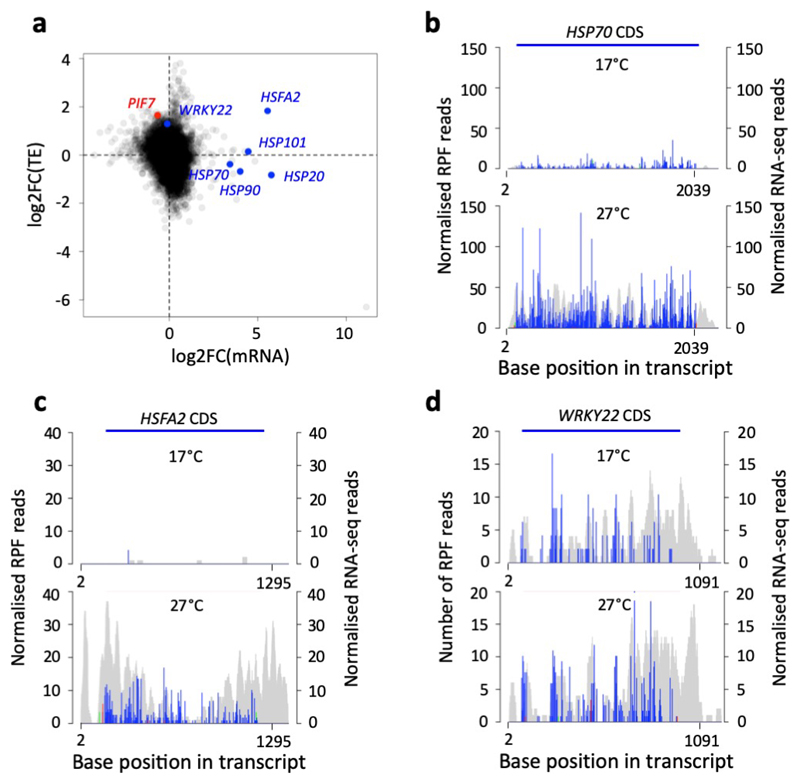
Extended Data Fig. 1. PIF7, HSFA2 and WRKY22 show enhanced translation at warm temperature.
a Scatter plot of log fold changes in TE and mRNA abundance observed in Ribo-seq with parallel RNA-seq.
b-d Histograms of 5′ end positions of normalized 28-nucleotide RPF reads (blue, green and red for frames 0, 1 and 2, left axis) and RNA-Seq reads (grey, right axis) mapped to the HSP70 (b), HSFA2 (c) and WRKY22 (d) transcript.

