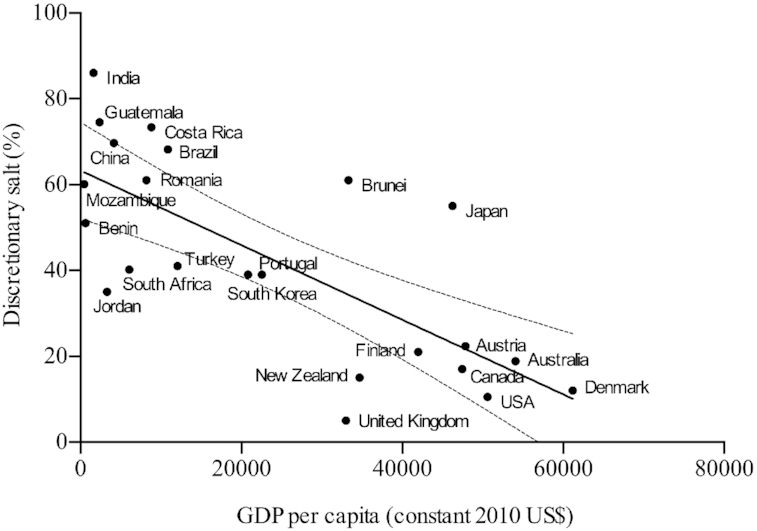
FIGURE 3.

Daily discretionary salt intake (% of total salt intake) as a function of per capita GDP. The per capita GDP figures, expressed in constant 2010 US dollars, were obtained for the year when data were collected for each study. A statistically significant linear regression fit (solid line) was found (F = 25.3, P < 0.0001) with an R2 of 0.55 and slope equal to −0.00087 (95% CI: −0.0012, −0.00051). The 95% CI of the regression line in depicted by the dashed lines. GDP, gross domestic product.
