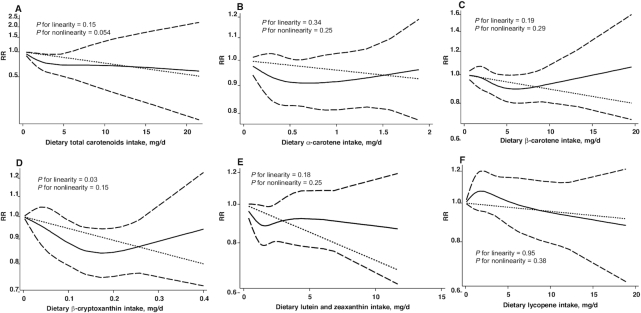
FIGURE 4.
Dose-response relations between dietary intake of total carotenoids (A; n = 191,744), α-carotene (B; n = 363,092), β-carotene (C; n = 444,126), β-cryptoxanthin (D; n = 360,758), lutein and zeaxanthin (E; n = 360,758), and lycopene (F; n = 360,758) and RRs of bladder cancer in adults. Data were modeled with random-effects restricted cubic spline models with 4 knots (5th, 35th, 65th, and 95th percentiles) and using the Greenland and Longnecker method (29) to estimate the covariances of multivariable-adjusted RRs. Lines with long dashes represent the pointwise 95% CIs for the fitted nonlinear trend (solid line). Lines with short dashes represent the linear trend.

