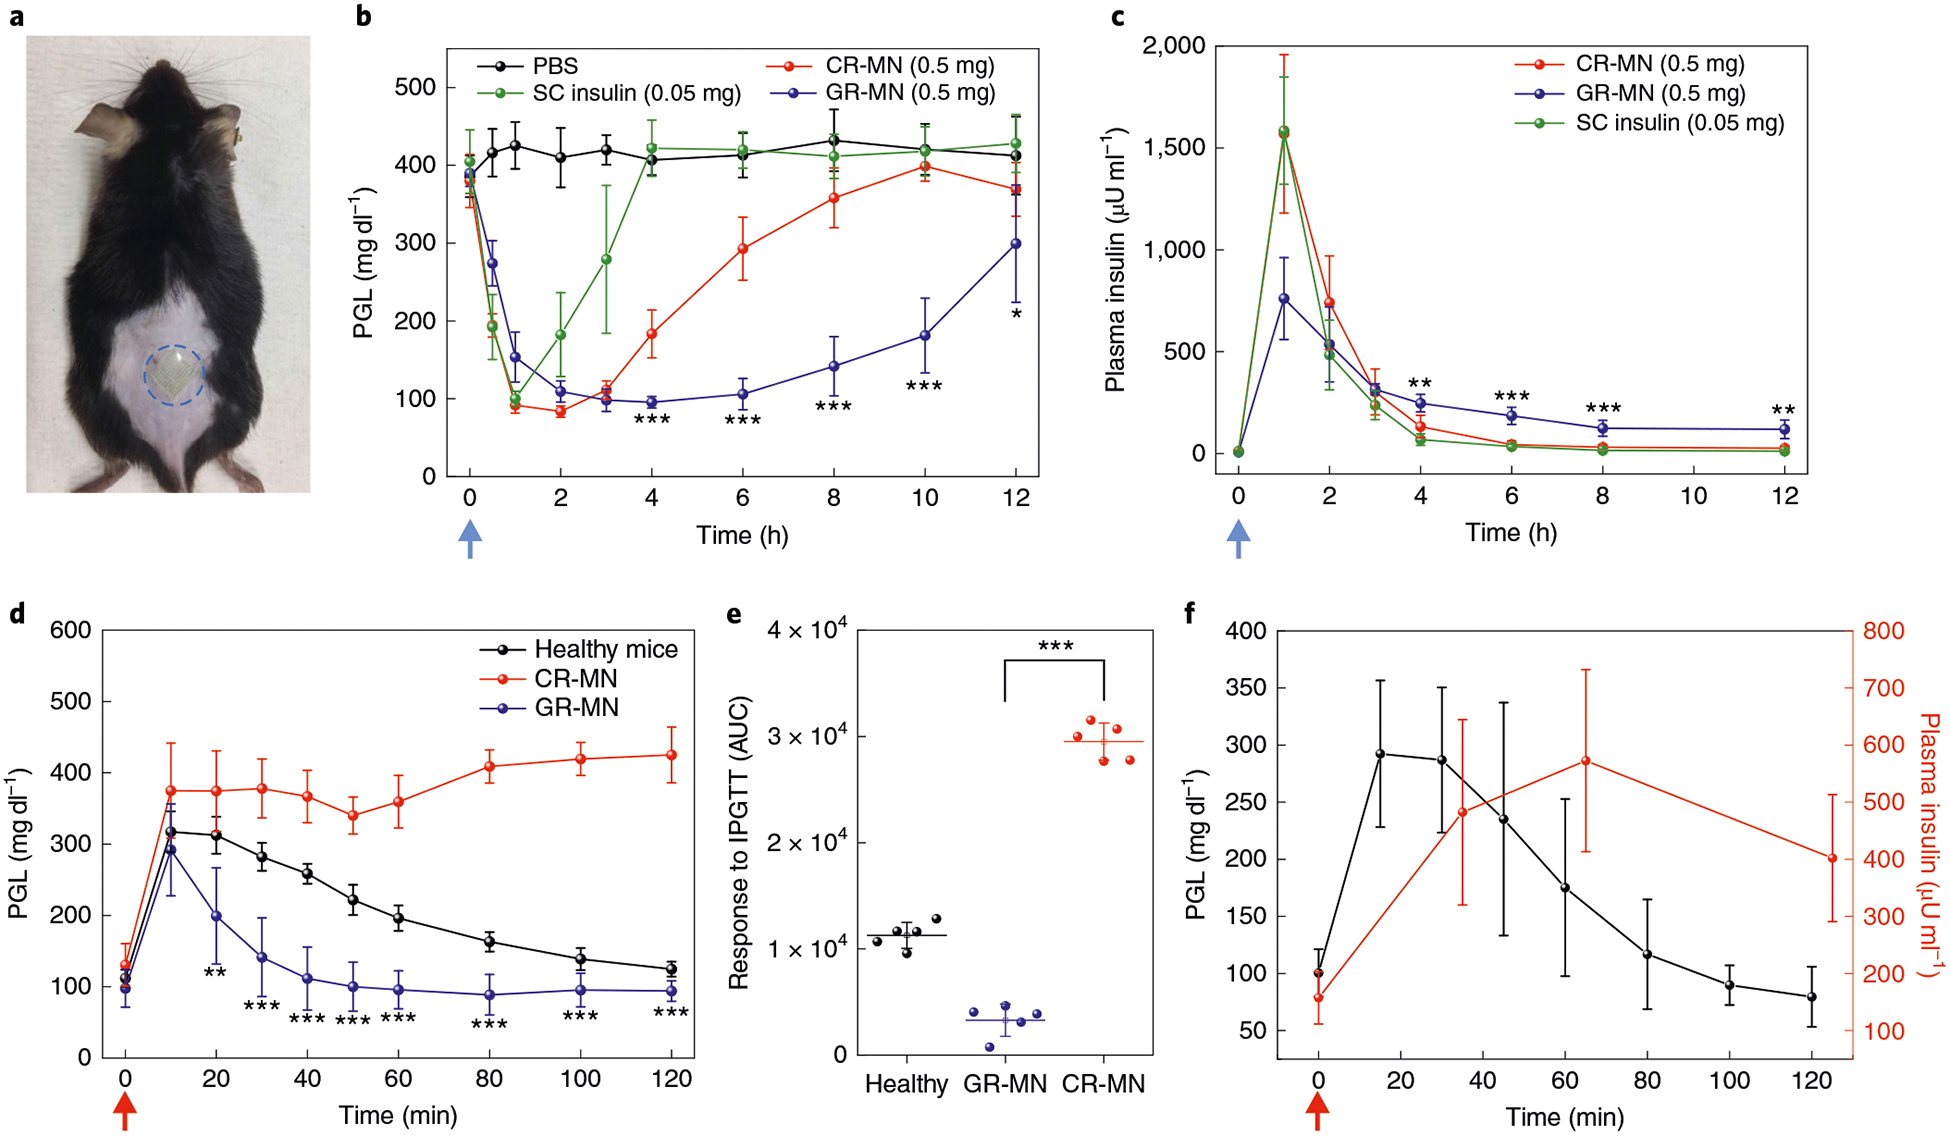
Fig. 3 |. In vivo evaluation of the GR-MN patch in an STZ-induced diabetic mouse model.

a, Mouse dorsum skin (the area within the blue dashed line) transcutaneously treated with a microneedle patch. b,c, PGLs (b) and plasma human insulin concentrations (c) in STZ-induced diabetic mice (n = 5) after treatment with PBS, subcutaneous insulin solution (insulin dose: 0.05 mg), the CR-MN patch (insulin dose: 0.5 mg) or the GR-MN patch (insulin dose: 0.5 mg). SC, subcutaneous. Statistical significance for comparison of the GR-MN and CR-MN groups was determined by two-tailed Student’s f-test (from left to right in b: ***P = 2.94×10⁻⁴ at 4h; ***P = 1.29×10⁻⁵ at 6 h; ***P = 1.16×10⁻⁵ at 8 h; ***P = 1.09×10⁻⁵ at 10 h; *P = 0.0478 at 12 h; from left to right in c: **P = 6.42×10⁻³ at 4h; ***P = 1.21×10⁻⁴ at 6h; ***P= 9.45×10⁻⁴ at 8h; **P= 2.14×10⁻³ at 12h). d, In vivo intraperitoneal glucose tolerance test in diabetic mice (n = 5) at 4h post-administration of GR-MN or CR-MN compared with healthy control mice. Glucose dose: 1.5gkg−1. Statistical significance for comparison of the GR-MN and CR-MN groups was determined by two-tailed Student’s f-test (**P= 2.13 ×10⁻³ at 20 min; ***P = 5.76 × 10⁻⁵ at 30 min; ***P = 8.89×10⁻⁶ at 40 min; ***P = 1.64×10⁻⁶ at 50 min; ***P = 1.18 × 10⁻⁶ at 60 min; ***P = 5.06 × 10⁻⁸ at 80 min; ***P = 1.96 × 10⁻⁸ at 100 min; ***P = 1.02 × 10⁻⁷ at 120min).e, Responsiveness in diabetic mice (n = 5) was calculated based on the area under the curve (AUC) from 0–120min, with the baseline set at the 0-min plasma glucose reading. Statistical significance was determined by two-tailed Student’s f-test (***P = 6.26 ×10⁻⁹). f, In vivo glucose-responsive insulin release promoted by intraperitoneal glucose challenge at 4h post-administration of GR-MN in diabetic mice (n = 5). Glucose dose: 3gkg−1. In b,c, the blue arrows indicate the time points of microneedle administration. In d,f, the red arrows indicate the time points of glucose administration. In b-f, data are presented as mean ± s.d.
