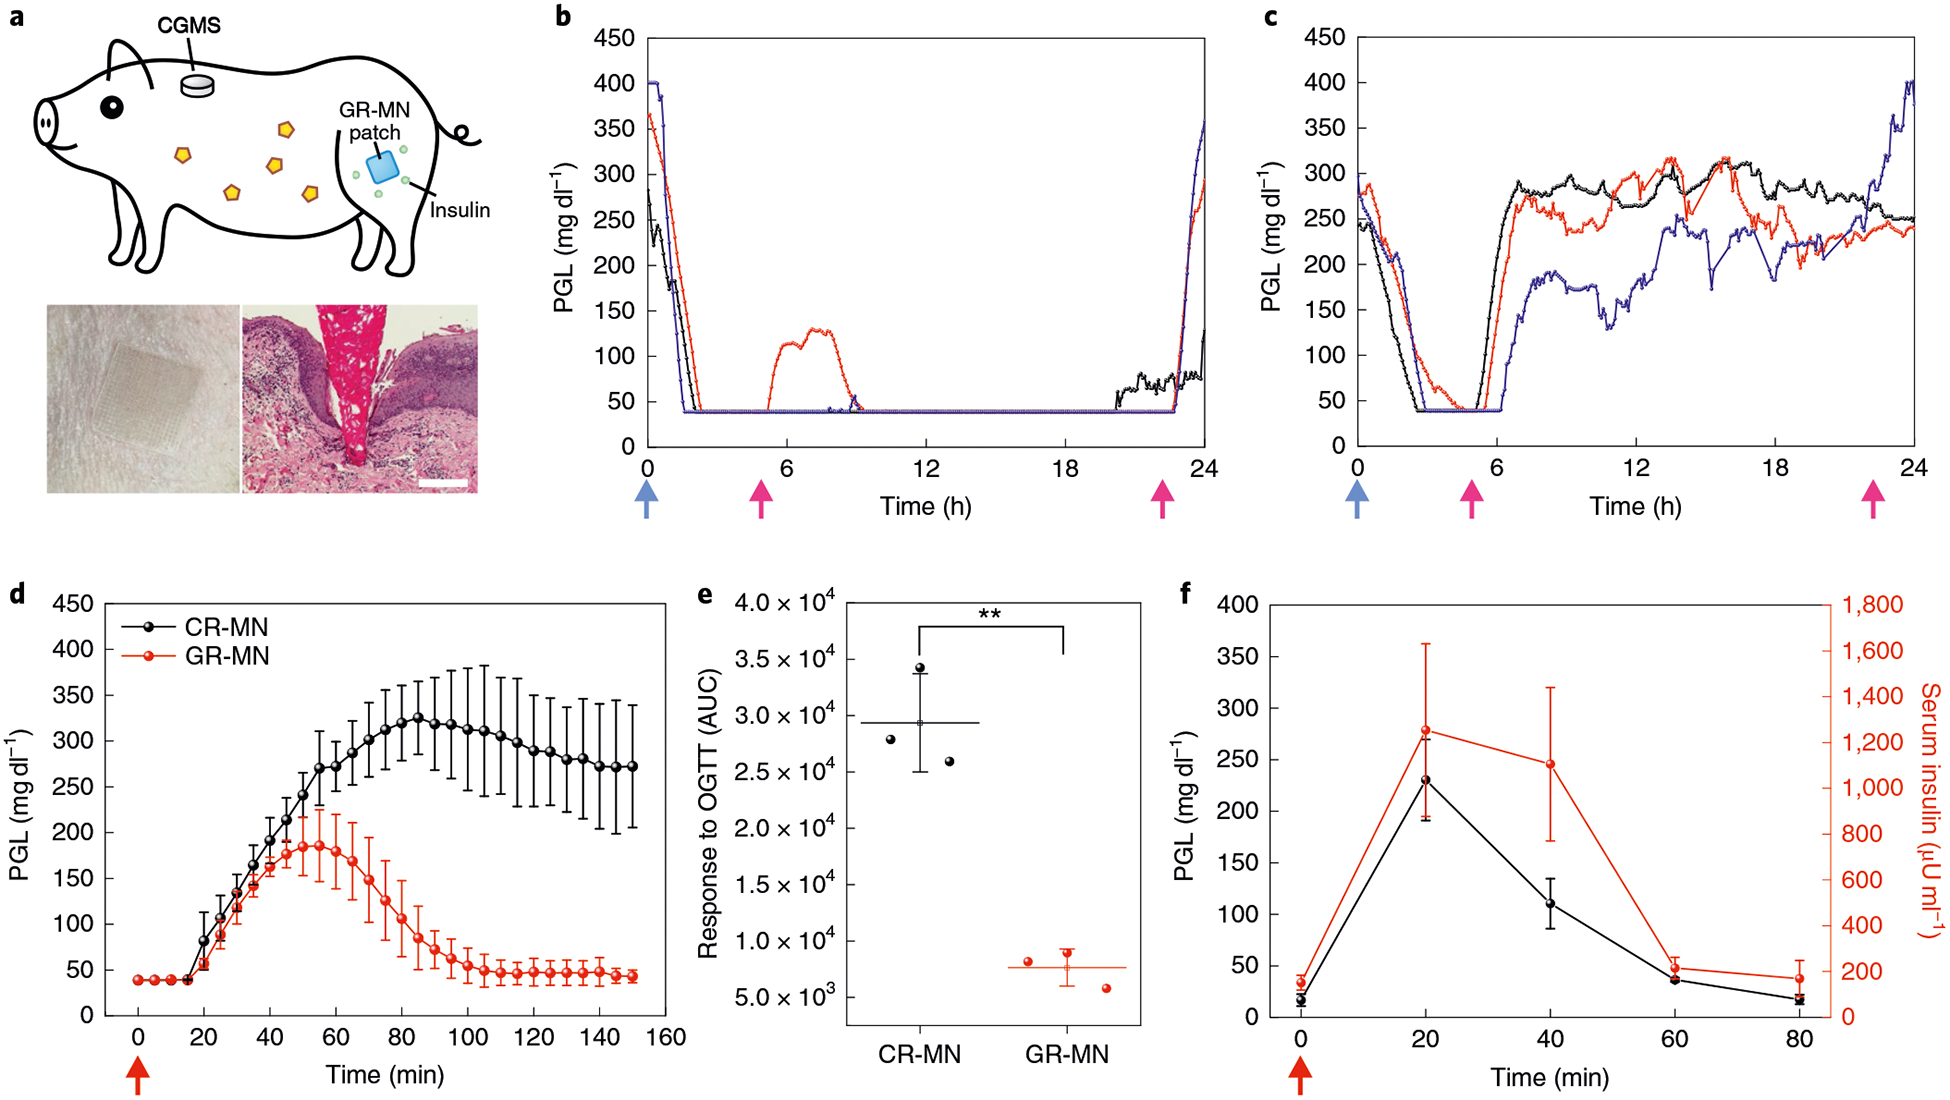
Fig. 4 |. in vivo evaluation of GR-MN in an STZ-induced diabetic minipig model.

a, Top: schematic of a minipig treated with GR-MN at the leg site and monitored with a CGMS. Bottom left: photograph of a GR-MN patch applied on a minipig’s leg. Bottom right: haematoxylin and eosin-stained section of minipig skin penetrated by one microneedle. Scale bar, 200 μm. b,c, PGLs in STZ-induced diabetic minipigs (n = 3) after treatment with GR-MN (b) and CR-MN (c). Insulin dose: 7 mg. d, In vivo oral glucose tolerance test in diabetic minipigs (n = 3) at 4h post-administration of GR-MN or CR-MN. Glucose dose: 1 gkg−1. e, Responsiveness in diabetic minipigs (n = 3) was calculated based on the AUC from 0–150 min, with the baseline set at the 0-min plasma glucose reading. Statistical significance was determined by two-tailed Student’s f-test (**P = 1.27 ×10⁻³). OGTT, oral glucose tolerance test. f, In vivo glucose-responsive insulin release promoted by intravenous glucose challenge at 4h post-administration of the GR-MN patches in diabetic minipigs (n = 3). Glucose dose: 0.7g kg−1. The detection range of CGMS was 40–400 mgdl−1. In b,c, the blue arrows indicate the time points of microneedle administration and the pink arrows indicate the time points of feeding. In d,f, the red arrows indicate the time points of glucose administration. In d-f, data are presented as mean ± s.d.
