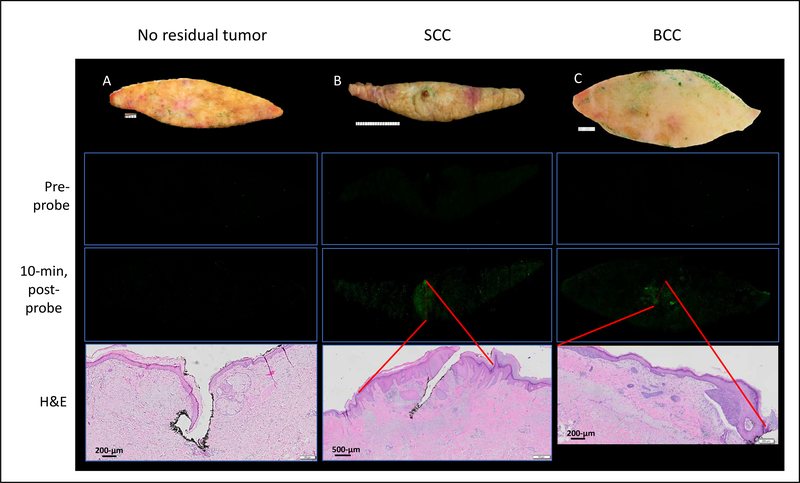
Figure 2.
Gross correlation of fluorescence with histology. Specimen noted to have no residual cancer on histology and demonstrated no detectable fluorescent signal at baseline and 10-min after probe application (A). Specimens with residual SCC (B) and BCC (C) revealed areas of bright fluorescent signal that correlated with the areas of tumor present on histology (red lines mark the boundaries for SCC and BCC present on H&E and their position triangulated via fiduciaries onto the 10-min post-probe fluorescent image per Methods). H&E section represented by semi-transparent red dashed line on 10-min post-probe image.

