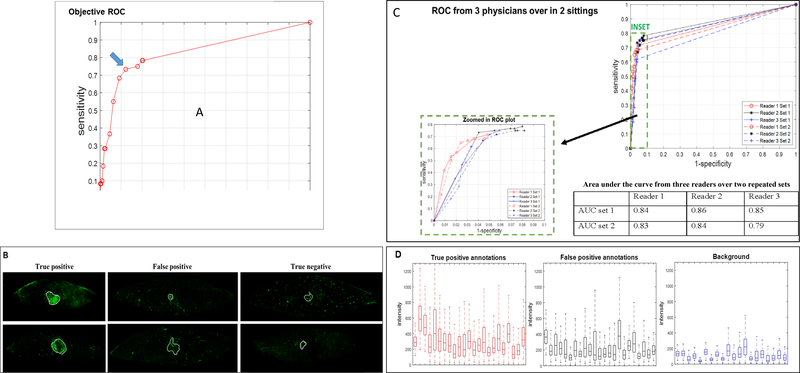
Figure 6.
Analysis of sensitivity and specificity, reader study, and fluorescence intensity. Objective ROC plot is shown plotting 1-specificity vs. sensitivity (A). The optimal cut point was identified by the blue arrow (A, blue arrow), corresponding to intensity threshold 250, with sensitivity of 0.73 and specificity of 0.88. Empirical area under curve was 0.83. Representative annotations performed by readers are shown in (B). “True positive” samples were assigned as those that have histology-confirmed tumor positivity and reader confidence of 3–5 (far left column: upper row, 4 out of 5 (4/5) confidence and lower row, 5/5 confidence). “False positive” samples were assigned as those with histology-confirmed tumor negativity and high reader confidence (middle column: upper row, 5/5 and lower row, 3/5). In the middle column, the upper row represents fluorescence from an actinic keratosis (conventionally described as a pre-cancerous lesion), and the lower row represents a foreign body granuloma. “True negative” samples were assigned as those that have histology-confirmed tumor negative and corresponding low reader confidence (far right column: upper row, 2/5 and lower row, 2/5). Reader study ROC curves from three readers over two sittings performed at least 5 days apart are shown (C). Due to the high specificity of the ROC results, a zoomed in ROC plot is shown as an inset for improved visualization. Empirical area under curves are 0.84, 0.86 and 0,85 for the three readers in the first set, and 0.83, 0.84, and 0.79 for three readers in the second set as shown. The highest sensitivity and corresponding specificity are 0.72/0.95, 0.78/0.92, and 0.75/0.94 for the three readers in the first set, and 0.68/0.95, 0.75/0.92, and 0.62/0.97 for the same three readers in the second set of blinded readings (C, Table). Fluorescence intensity box plots are shown for true positive and false positive annotations and tissue background (D).

