
Figure A.9:
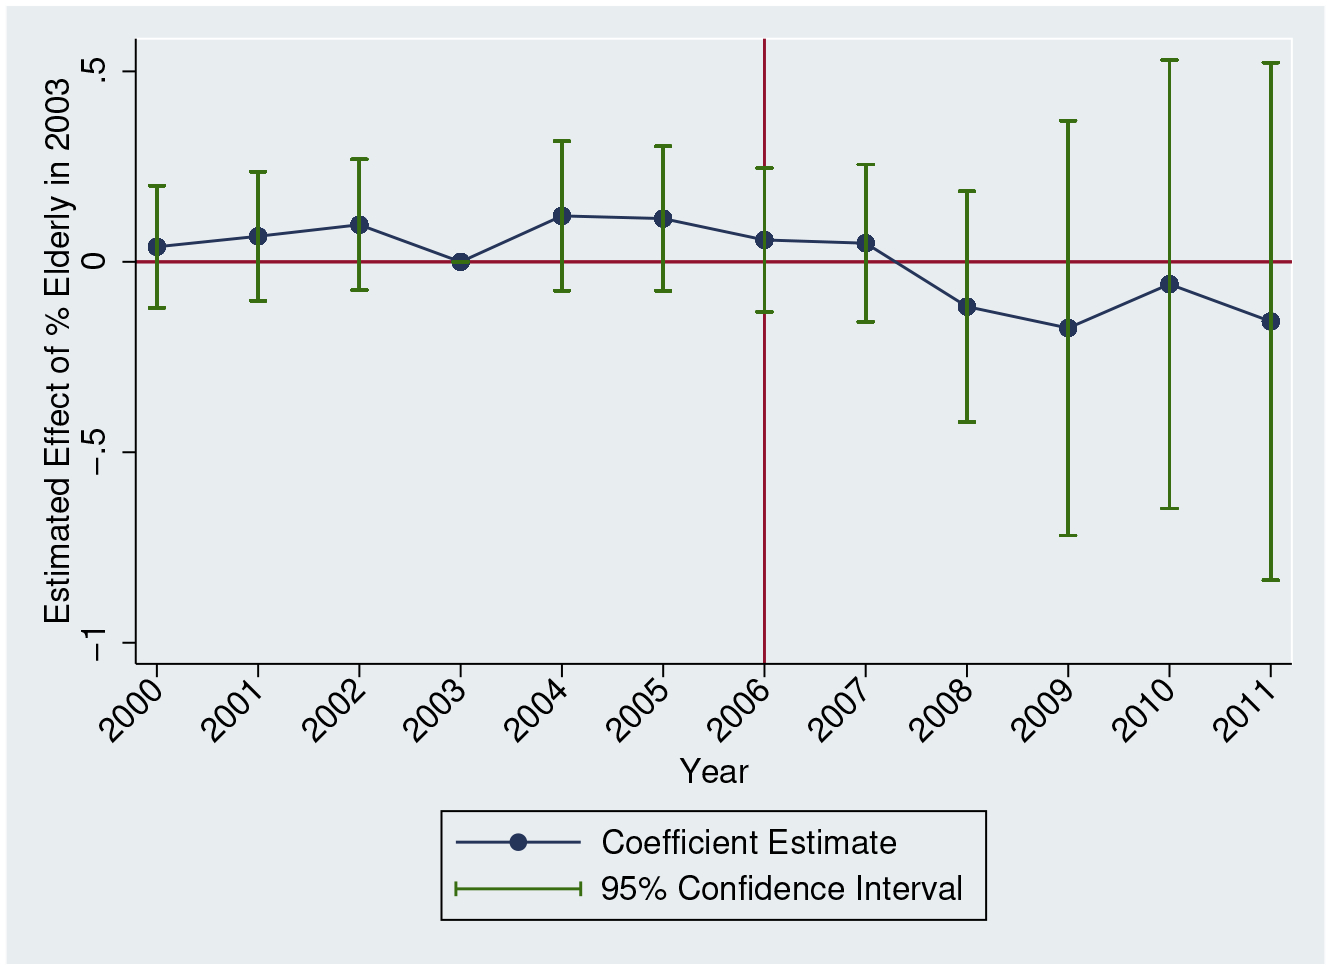
Event Study Estimates for Buprenorphine Distribution
Sources: ARCOS
Notes: The outcome is buprenorphine grams per capita. Each estimate refers to the effect of 2003 Elderly Share in that year. All specifications include controls for time and state fixed effects. We also include all controls used in Table 3, Column 4. Regressions are population-weighted. Estimates are normalized to 0 in 2003. 95% confidence intervals adjusted for clustering at the state level.