
Figure A.2:
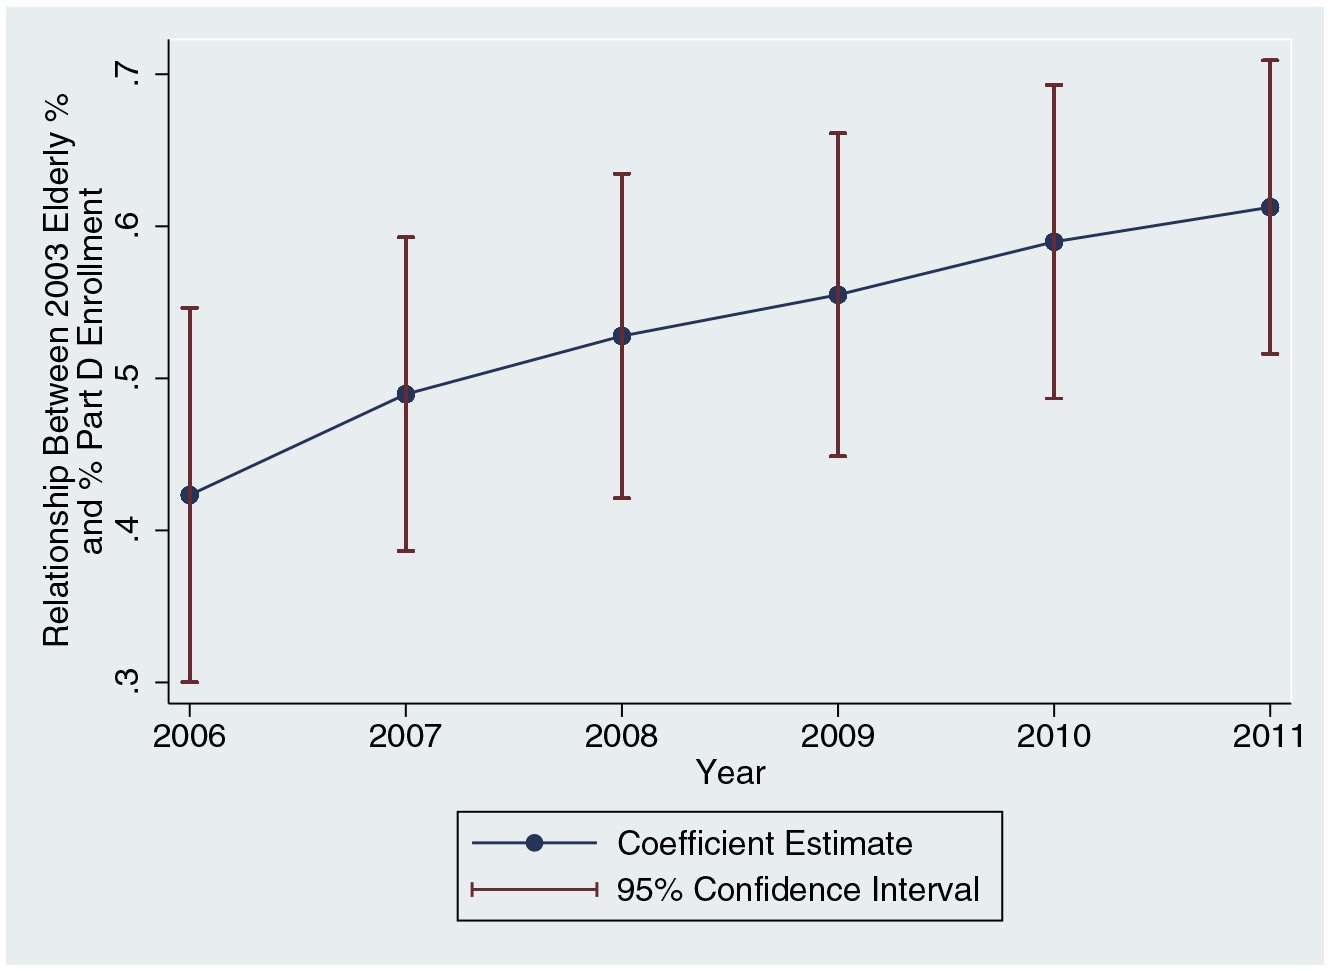
Relationship between % Elderly in 2003 and % Enrolled in Part D
Notes: We regress the percentage of the population enrolled in Part D on the percentage of the 2003 population ages 65+. We perform this cross-sectional regression by year.
Official websites use .gov
A
.gov website belongs to an official
government organization in the United States.
Secure .gov websites use HTTPS
A lock (
) or https:// means you've safely
connected to the .gov website. Share sensitive
information only on official, secure websites.
Relationship between % Elderly in 2003 and % Enrolled in Part D
Notes: We regress the percentage of the population enrolled in Part D on the percentage of the 2003 population ages 65+. We perform this cross-sectional regression by year.