
Fig. 4 |. Plasmonic-fluor enhanced high-throughput proteome profiler array.
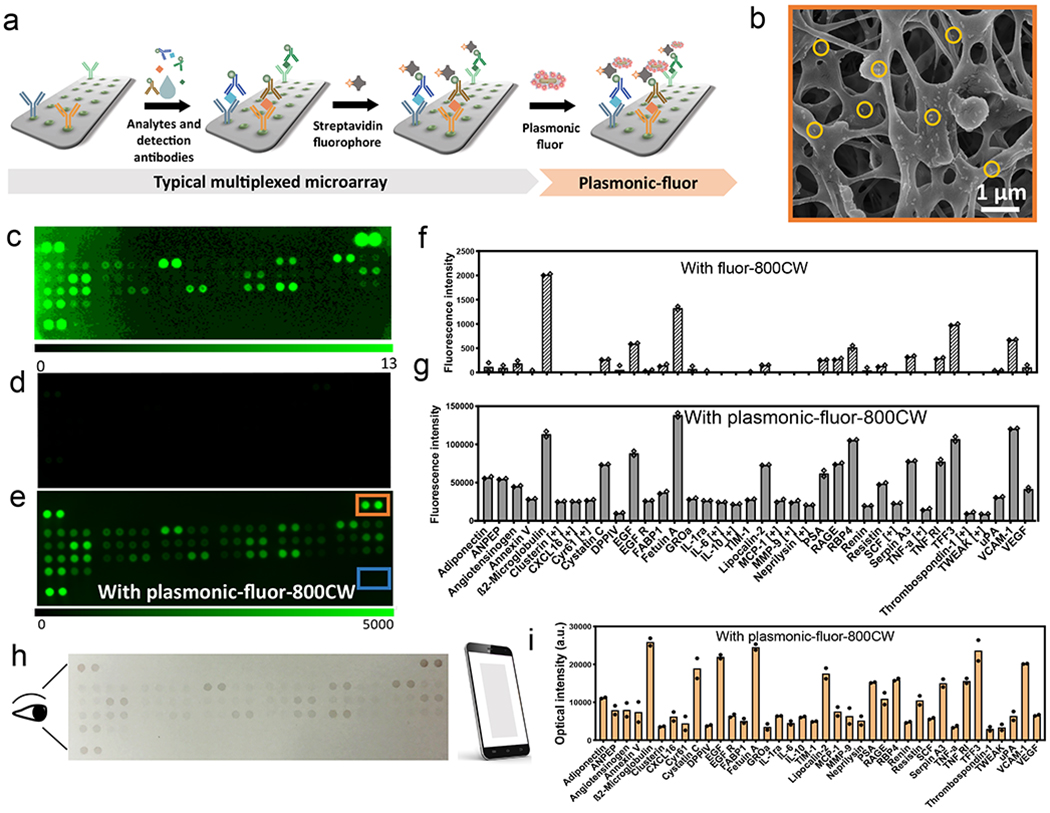
a, Illustration showing the application of plasmonic-fluor-800CW to enhance the bioanalytical parameters of multiplexed proteome profiler for human kidney disease biomarkers implemented on a nitrocellulose membrane. b, SEM image showing the uniform distribution of plasmonic-fluor-800CW (a few highlighted by the yellow circles) on and in subsurface regions of the nitrocellulose membrane. Fluorescence intensity map representing kidney disease protein biomarker profile of a kidney disease patient obtained (c, d) using conventional fluorophores (streptavidin-800CW) and (e) after the addition of plasmonic-fluor-800CW (note the difference in fluorescence intensity scale bar). Fluorescence intensity corresponding to the concentrations of various urinary biomarkers (f) before (typical assay using conventional fluorophore) and (g) after the addition of plasmonic-fluor-800CW. [+] indicates biomarkers detected only with plasmonic-fluor-800CW. Experiment was repeated three times independently on different days with different batches of plasmonic-fluors and the data is shown in supporting information. h, Photograph (acquired by mobile phone) showing the colour change of the nitrocellulose membrane with urine sample from kidney disease patient after the addition of plasmonic-fluor-800CW. i, Histogram showing the optical intensity of the mobile phone acquired photograph corresponding to each analyte in the patient urine sample.