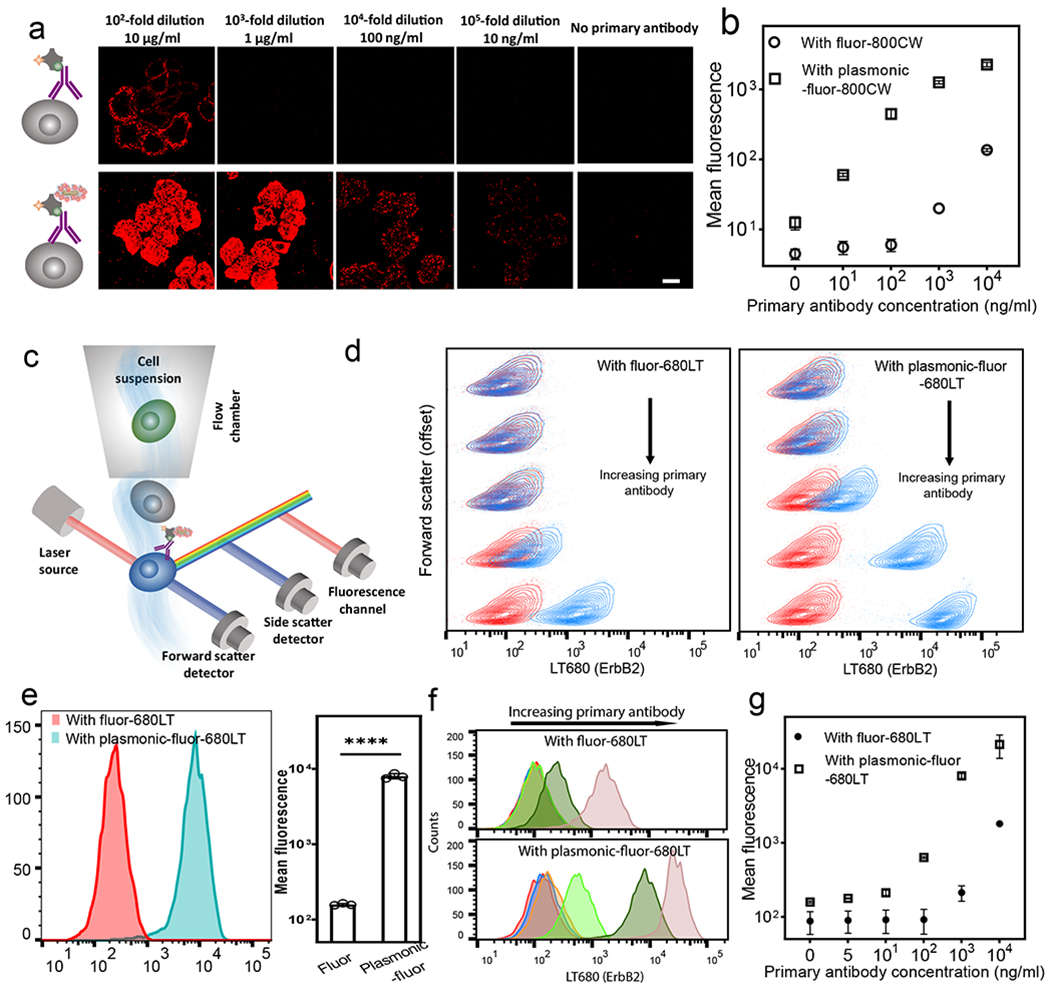
Fig. 5 |. Plasmonic-fluor enhanced immunocytochemistry and flow cytometry.

a, Confocal laser scanning microscopy (CLSM) images of breast cancer cells (SK-BR-3) probed with conventional fluor (800CW, top row) and plasmonic-fluor-800CW (bottom row) at different concentrations of ErbB2 primary antibody. Scale bar, 10 μm. b, Plot showing the fluorescence intensity of SK-BR-3 cells stained with conventional fluor and plasmonic-fluor-800CW. Error bars, s.d. (over three different locations). c, Schematic showing flow cytometry of ErbB2-stained SK-BR-3 cells probed by conventional fluor (680LT) followed with plasmonic-fluor-680LT. d, Flow contour plot (with outliers) of fluorescence vs. forward scatter (vertically offset for clarity) of SK-BR-3 cells probed using different concentrations of ErbB2 primary antibody (Red: control group without adding primary antibody. Blue: cells treated with different dilutions of primary antibody). Cells are stained with conventional fluor (680LT, left plot) followed by the addition of plasmonic-fluor-680LT (right plot). e, Fluorescence histogram of SK-BR-3 cells probed using conventional fluor (680LT) followed by the addition of plasmonic-fluor-680LT (at 103-fold dilution of primary antibody). Error bars, s.d. (n=3 independent tests). ****p < 0.0001 by two-tailed unpaired t-test with Welch’s correction. f, Histogram showing fluorescence for SK-BR-3 cells before (top) and after (bottom) the addition of plasmonic-fluor-680LT. Red: no primary antibody; blue: 2×10⁵-fold dilution; orange:105-fold dilution; light green: 104-fold dilution; green: 103-fold dilution; rose: 102-fold dilution of the stock solution provided by the vendor. g, Plot showing the mean fluorescence intensity obtained from flow cytometry at different primary antibody concentrations. Error bars, s.d. (n=3 independent tests). All experiments were repeated three times independently on different days with different batches of plasmonic-fluors and the data is shown in supporting information.
