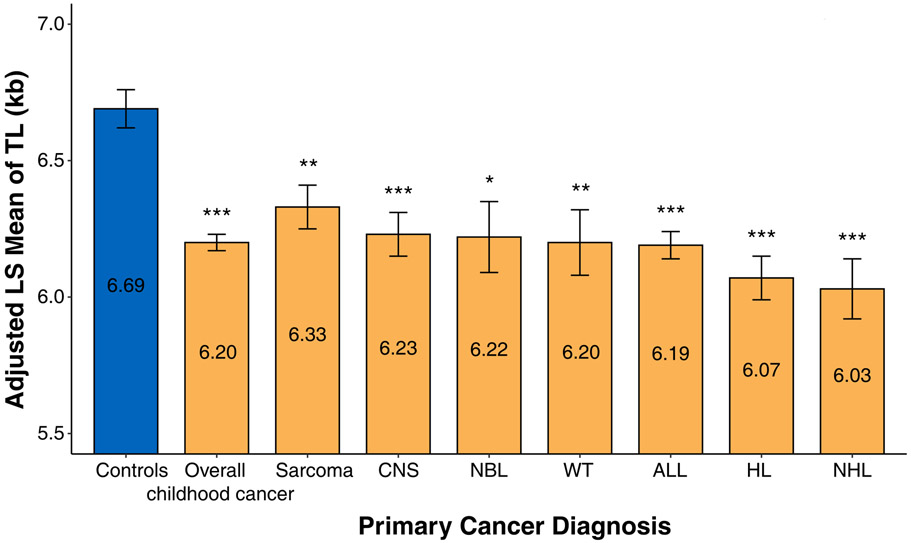
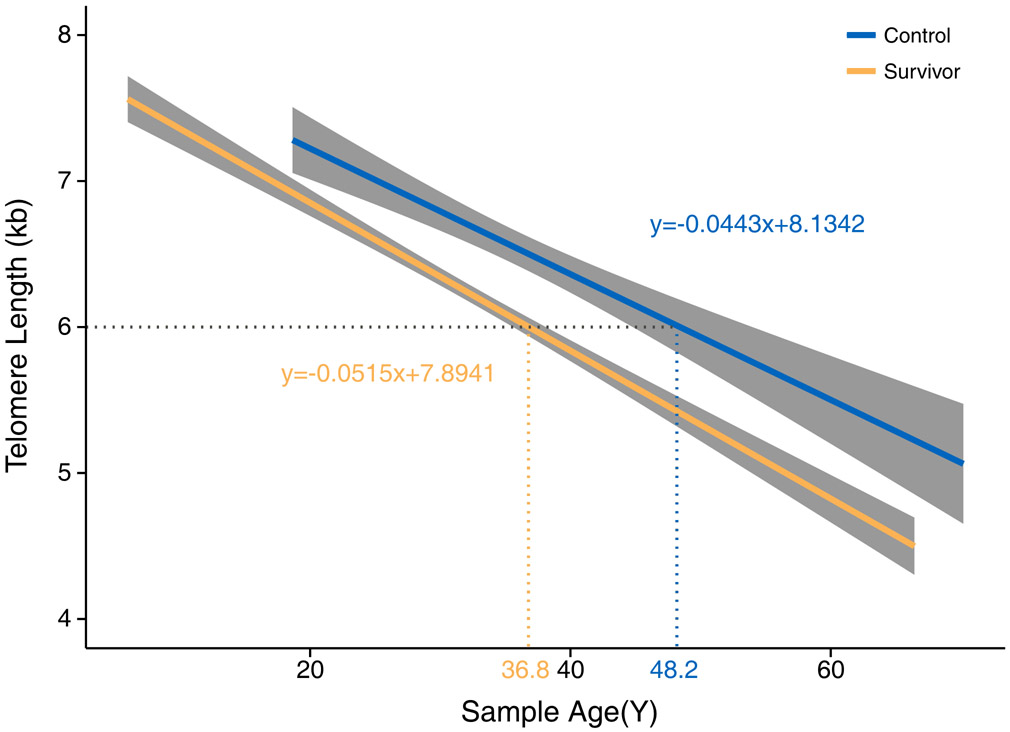
Figure 1.


(a) Adjusted least square mean of LTL in controls and survivors overall and by their diagnoses. Statistical significance levels were depicted by *P<0.05, **P<0.01, and ***P<0.001. Abbreviations: CNS (Central Nervous System), ALL (Acute Lymphocytic leukemia), NBL (Neuroblastoma), WT (Wilms’ tumor), HL (Hodgkin lymphoma), NHL (non-Hodgkin lymphoma). (b) Linear regression lines of LTL by age at DNA sampling for controls and survivors.
