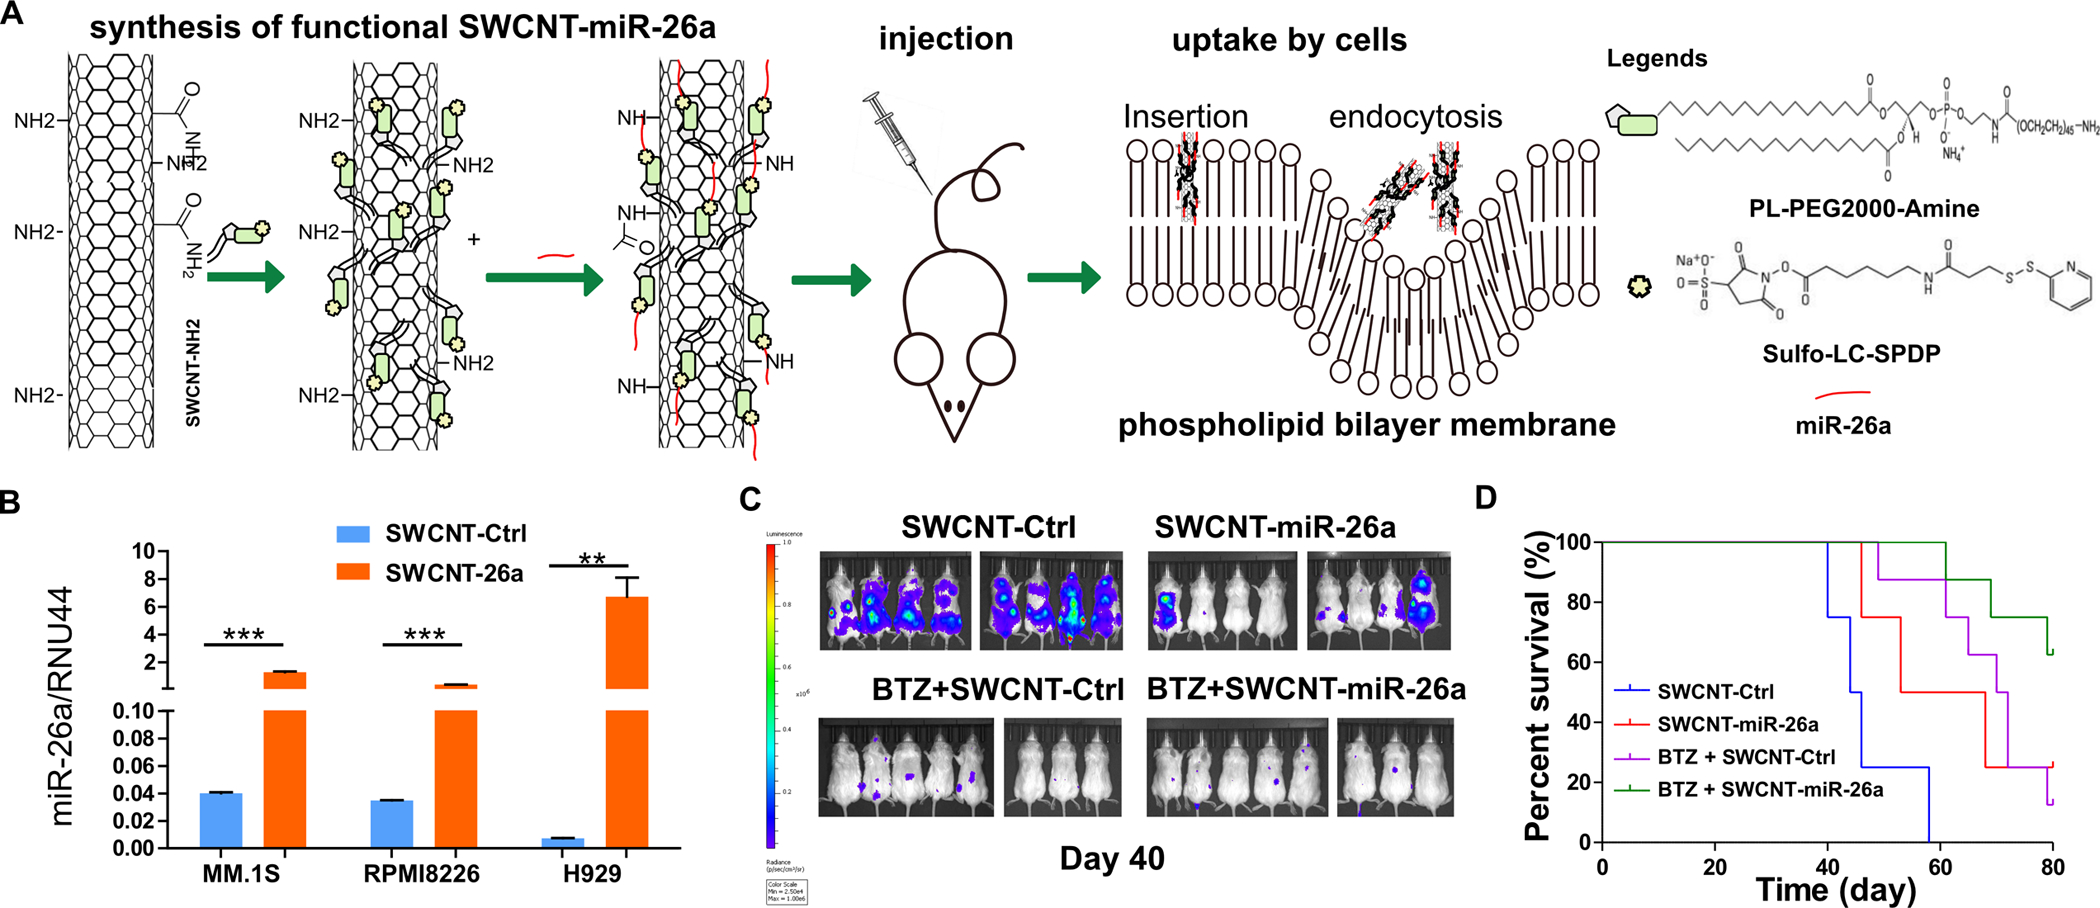
Figure 6. SWCNT-miR-26a treatment repressed myeloma growth disseminated murine models.

(A) The schematic diagram of SWCNT functioanlization, miR-26a conjugation, mouse model construction and miR-26a uptake processes. (B) RPMI8226, MM.1S, and H929 cells were cultured with SWCNT-ctrl or SWCNT-mir-26a for 48 hours and then were subjected to RNA extraction. The miR-26a level was determined by qRT-PCR with RUN44 as loading control. (C) SCID mice (8 mice each group) were intravenously injected with 1×10⁶ MM.1S-Luc-GFP cells, then injected with SWCNT-miR-26a or SWCNT-ctrl or BTZ (0.5 mg/kg) plus SWCNT-ctrl, or SWCNT-miR-26a combined with BTZ (0.5 mg/kg) once a week through the tail vein. Images were acquired using an in vivo imaging system (IVIS) (PerkinElmer). Hind limb paralysis was used as the end point. (D) Time to the endpoint of hind limb paralysis was measured using the Kaplan–Meier method, with Cox proportional hazard regression analysis for group comparison. SWCNT-Ctrl vs. SWCNT-miR-26a P = 0.02; SWCNT-Ctrl vs. bortezomib, P = 0.0003; SWCNT-Ctrl vs. BTZ + SWCNT-miR-26a, P < 0.0001; BTZ + SWCNT-Ctrl vs. BTZ + SWCNT-miR-26a, P = 0.026; BTZ + SWCNT-Ctrl vs SWCNT-miR-26a, P = 0.75.
