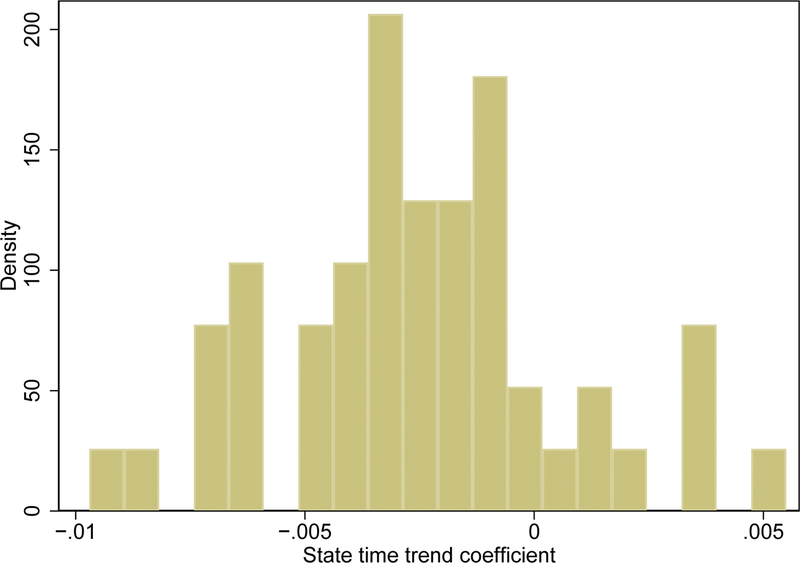
Appendix Figure 1:
Density of state time trend coefficients, ATUS sample
Note: Figure plots the distribution of coefficients of state-specific linear time trends from a regression model of binary provision of informal care on state fixed effects and state-specific linear time trends. Sample is individuals aged 40 and over in the ATUS.

