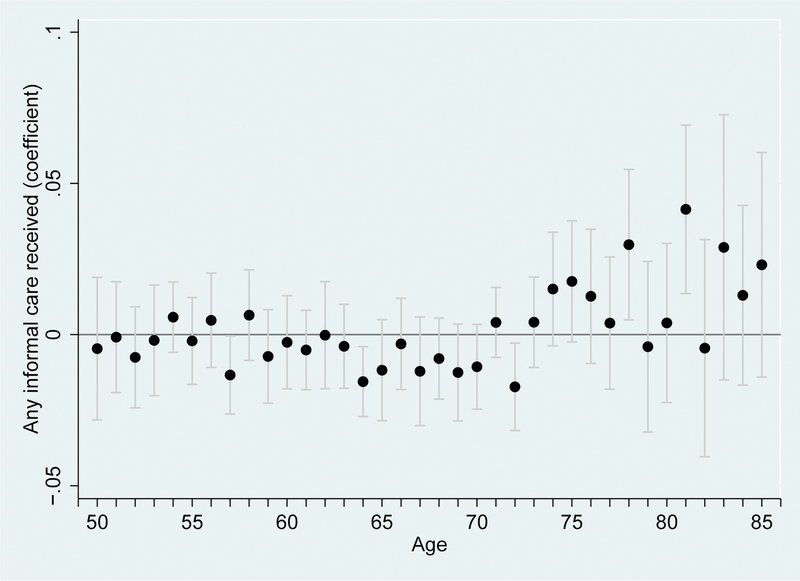
Appendix Figure 2:
Effect of macroeconomic conditions on informal care receipt, by age
Note: Figure plots the coefficients and their 95% confidence intervals by age from a regression of any informal caregiving in the sample of individuals aged 40 and over in the ATUS. The specification is estimated using a linear probability model and controls for a quadratic in age, gender education, marital status, race and ethnicity, family size, share of the state population aged 18–64 and aged 65 and over, state log expenditures on total Medicaid and Medicaid HCBS services for the older population and population with physical disabilities, as well as state, year, and linear time trends by state, and is weighted using individual-level weights. Standard errors are clustered by state. * p < 0.10, ** p < 0.05, *** p < 0.01.

