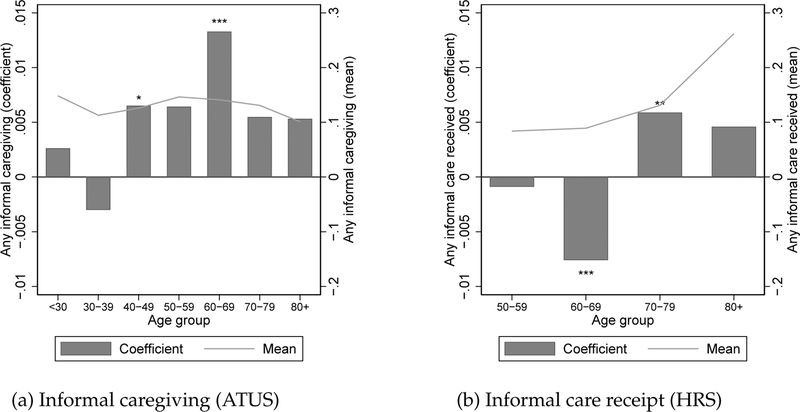
Figure 1:
Effect of macroeconomic conditions on informal care, by age
Notes: Bars denote coefficients on separate regressions of any informal caregiving in the ATUS in panel (a) and any informal care received in the HRS in panel (b) on the unemployment rate for each age group. All specifications are estimated using a linear probability model and control for a quadratic in age, gender, education, marital status, race and ethnicity, share of the state population aged 18–64 and aged 65 and over, state log expenditures on total Medicaid and Medicaid HCBS services for the older population and population with physical disabilities, as well as state, year, and linear time trends by state. HRS regressions additionally control for number of children. The ATUS regressions additionally control for family size and are weighted using individual-level weights. Standard errors are clustered by state. Mean rates of caregiving and care receipt by age bin are denoted by the solid line. * p < 0.10, ** p < 0.05, *** p < 0.01

