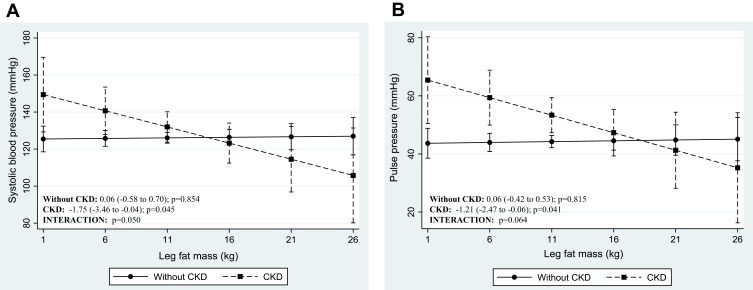
Figure 2.
Adjusted association between blood pressure indices and DXA-derived measures of body fat distribution, dichotomized by CKD status. Presentation of graphs are as follows: Adjusted association between, (A) systolic blood pressure and leg fat mass, (B) pulse pressure and leg fat mass. Data is presented as (1) linear predictive margins for those with CKD (dashed line) and those without CKD (solid line) with 95% CI and (2) the average marginal effect (dy/dx), 95% CI and p-value indicating the association between blood pressure and measures of body fat distribution, for those with and without CKD.

