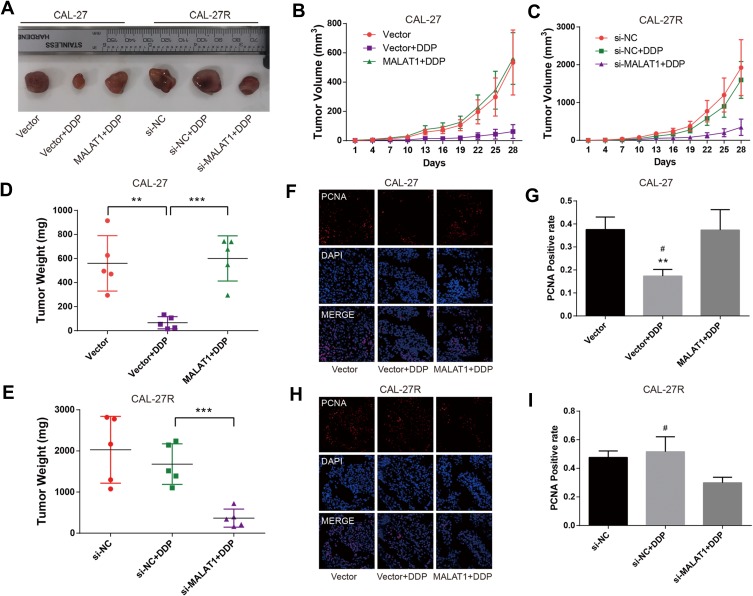
Figure 6.
MALAT1 regulated DDP resistance in nude mice xenograft models of OSCC. (A) Photographs of dissected tumors in nude mice. (B, C) The tumor volume fluctuation of the mice was measured every three days. (D, E), The tumor weight of the mice was measured in the end. (F–I) immunofluorescence staining detected PCNA-positive cells in xenograft tumor tissue. **P<0.01, ***P<0.001, compared with Vector group. #P<0.05, compared with MALAT1+DDP or si-MALAT1+DDP group.

