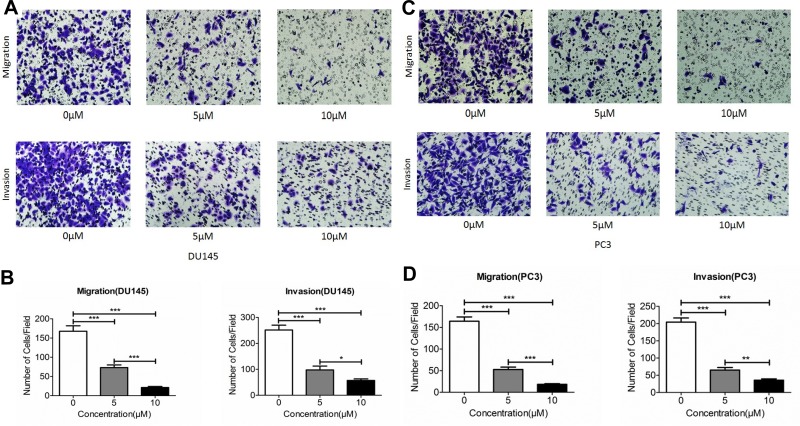
Figure 4.
Effect Ibrutinib on migration and invasion of prostate cancer cells. Cell migration and invasion were assessed using Transwell assay as described in the methods. (A) Effect of Ibrutinib on migration (top row) and invasion (bottom row) in DU145 cells. (B) Quantification of the Ibrutinib inhibitory effect on DU145 cell migration (left) and invasion (right). Vertical axes: migrated or invaded cell number per field; horizontal axes: Ibrutinib concentration (µM). Open bar: control; gray bar: 5µM Ibrutinib; dark bar: 10µM Ibrutinib. *P < 0.05; **P < 0.01; ***P < 0.001. (C) Effect of Ibrutinib on migration (top row) and invasion (bottom row) in PC3 cells. (D) Quantification of the Ibrutinib inhibitory effect on PC3 cell migration (left) and invasion (right). Vertical axes: migrated or invaded cell number per field; horizontal axes: Ibrutinib concentration (µM). Open bar: control; gray bar: 5µM Ibrutinib; dark bar: 10µM Ibrutinib. *P < 0.05; **P < 0.01; ***P < 0.001.

