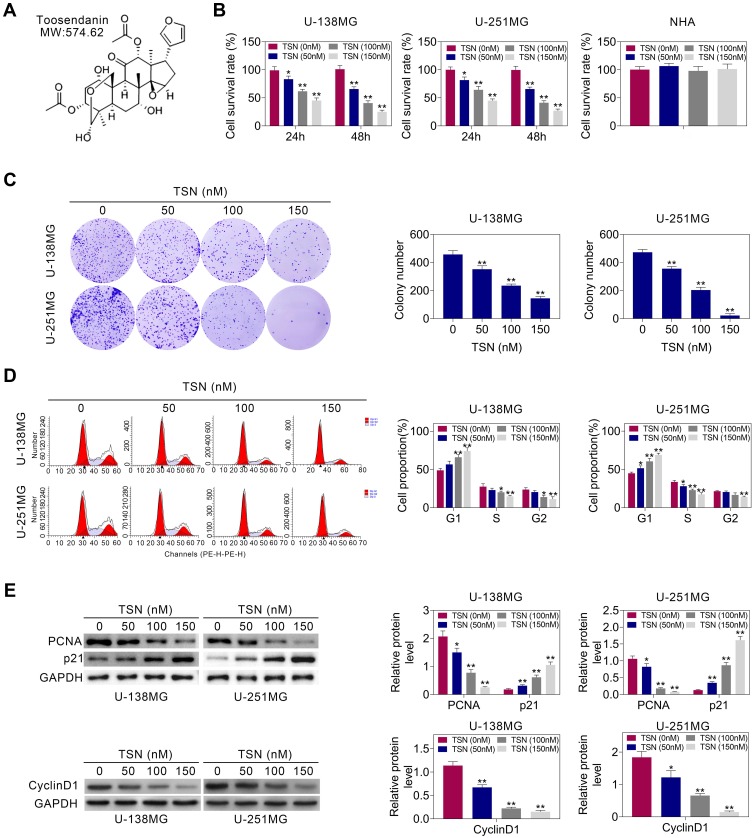
Figure 1.
TSN affects the proliferation of glioma cells. (A) The chemical structure of TSN. (B) Cell survival of NHA, U-138MG or U-251MG cells at 24h and 48h after TSN treatment (0nM, 50nM, 100nM, 150nM). The measurements of the cell growth rate were obtained using a CCK-8 kit. (C) Colony formation analysis of U-138MG or U-251MG cells after TSN treatment (0nM, 50nM, 100nM, 150nM). Colony numbers were quantified and shown as histograms. (D) Cell cycle analysis of U-138MG or U-251MG cells after TSN treatment (0nM, 50nM, 100nM, 150nM). Cell percentage in G1, S and G2 phages were quantified and shown as histograms. (E) The protein levels of PCNA, p21 and CyclinD1 in U-138MG or U-251MG cells after TSN treatment (0nM, 50nM, 100nM, 150nM), as determined using Western blotting. Relatively quantitative results were determined by Image J and shown as histogram. The data are expressed as the mean ± SEM, *P < 0.05, **P < 0.01.

