Figure 4.
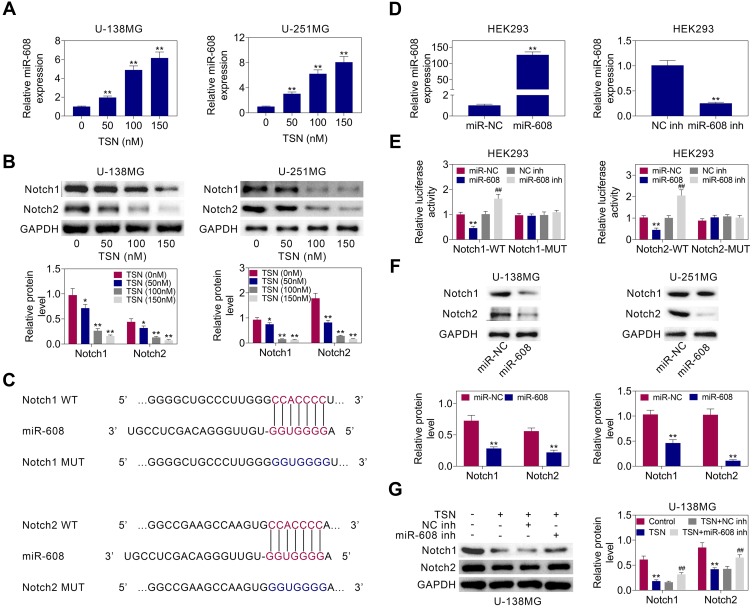
TSN up-regulates miR-608 level and negatively regulates Notch1 and Notch2 expressions. (A) The relative miR-608 levels in U-138MG or U-251MG cells after TSN treatment (0nM, 50nM, 100nM, 150nM), as determined using qRT-PCR. (B) The protein levels of Notch1 and Notch2 in U-138MG or U-251MG after TSN treatment (0nM, 50nM, 100nM, 150nM), as determined using Western blotting. Relatively quantitative results were determined by Image J and shown as histogram. (C) Intersection analysis of miR-608 and Notch1/Notch2 using prediction software of TargetScan. The predicted seed-recognition sites in the 3ʹ-UTR of Notch1 and Notch2 sequence and the corresponding miR-608 sequence was depicted. (D) The relative miR-608 levels in HEK293 cells after transfection with miR-NC or miR-608, as determined using qRT-PCR. (E) The relative luciferase activity of the Notch1 and Notch2 3ʹ-UTR reporter plasmids was assayed in HEK293 cells after transfection with miR-NC, miR-608, NC-inh or miR-608-inh. The mutant Notch1 and Notch2 3ʹ-UTR reporters were also used as controls. (F) The protein levels of Notch1 and Notch2 in U-138MG or U-251MG cells after transfection with miR-NC or miR-608, as determined using Western blotting. Relatively quantitative results were determined by Image J and shown as histogram. (G) The protein levels of Notch1 and Notch2 in U-138MG cells after treated with TSN, TSN+NC-inh or TSN+miR-608-inh, as determined using Western blotting. Relatively quantitative results were determined by ImageJ and shown as histogram. The data are expressed as the mean ± SEM, **/##P < 0.01.

