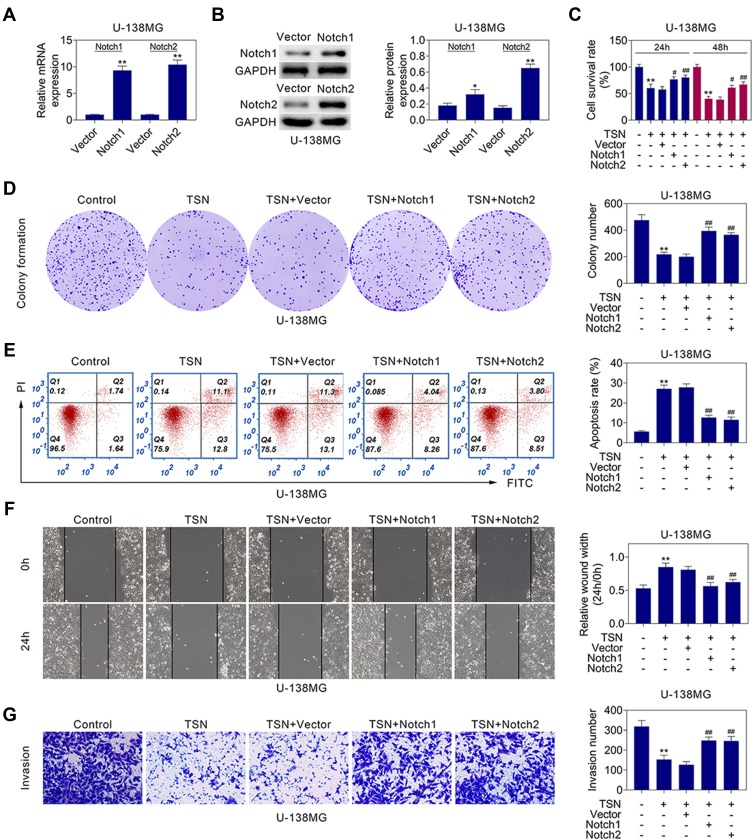
Figure 5.
Notch1 and Notch2 over-expression weakens TSN’s effect on glioma cells. (A) The relative mRNA levels of Notch1 or Notch2 in U-138MG cells after transfected Notch1 or Notch2 expressing plasmids, as determined using qRT-PCR. (B) The protein levels of Notch1 and Notch2 in U-138MG cells after Notch1 or Notch2 expressing plasmids, as determined using Western blotting. Relatively quantitative results were determined by Image J and shown as histogram. (C) Cell survival of U-138MG cells at 24h and 48h after treated with TSN, TSN+Vector, TSN+Notch1 or TSN+Notch2. The measurements of the cell growth rate were obtained using a CCK-8 kit. (D) Colony formation analysis of U-138MG cells after treated with TSN, TSN+Vector, TSN+Notch1 or TSN+Notch2. Colony numbers were quantified and shown as histograms. (E) Cell apoptosis analysis of U-138MG cells after treated with TSN, TSN+Vector, TSN+Notch1 or TSN+Notch2. Apoptosis rates were quantified and shown as histograms. (F) Wound scratch healing assay of U-138MG cells after treated with TSN, TSN+Vector, TSN+Notch1 or TSN+Notch2. Quantification of the wound-healing assay was shown as histograms. (G) Representative invasion assay images of U-138MG cells after treated with TSN, TSN+Vector, TSN+Notch1 or TSN+Notch2. The invaded cells were quantified and shown as histograms. The data are expressed as the mean ± SEM, */#P < 0.01, **/##P < 0.01.

