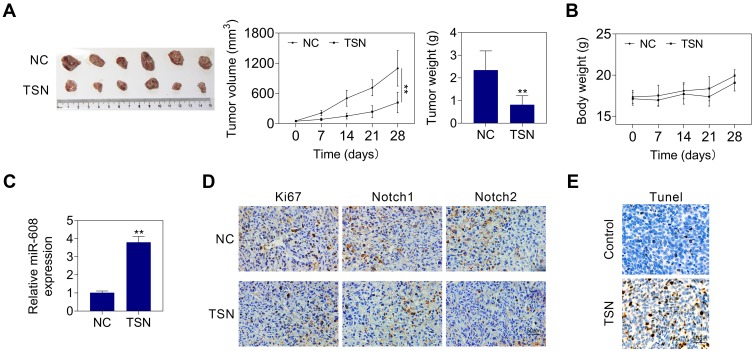
Figure 6.
TSN treatment inhibits tumor growth in a glioma mouse xenograft model. (A) Representative photograph of corresponding tumors dissected from mice at day 28 post-implantation (left). The xenograft tumor volumes (middle) and weight (right) of nude mice derived from subcutaneous implantation of U-138MG cells. (B) The body weight of mice from NC or TSN groups. (C) The relative miR-608 level in the xenograft tumors from NC or TSN groups. (D) IHC staining of Ki67 and Notch1/Notch2 in the xenograft tumors from NC or TSN groups. (E) TUNEL analysis in the xenograft tumors from NC or TSN groups. The data are expressed as the mean ± SEM, **P < 0.01.

