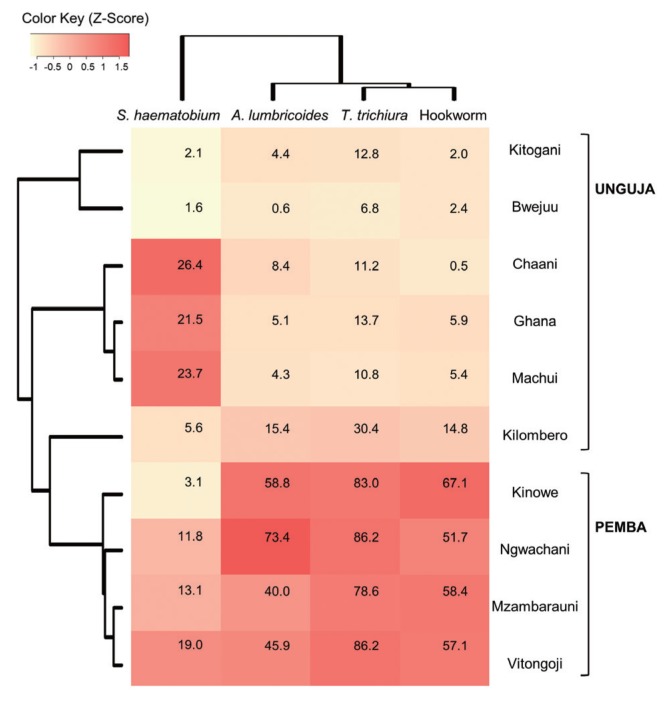
Fig. 2.
Heatmap showing the prevalence of soil-transmitted helminth infections and schistosomiasis in children from 10 schools in Zanzibar, Tanzania (2007–2009). Values in the cells represent the 3-year average prevalence of each parasitic infection in each school. The colors on the heatmap are based on z-scores calculated using relative prevalence of parasites infections (Z-score=[actual prevalence − mean prevalence along the 10 schools] /standard deviation).

