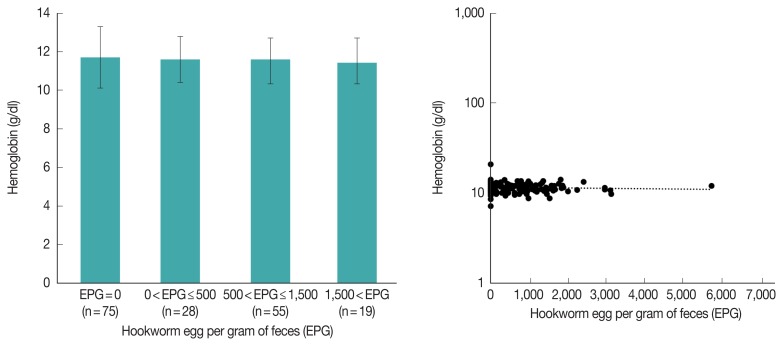
Fig. 5.
(A) Hemoglobin level by hookworm EPG grade. The data of the children on the Pemba island in 2009 were used. There were no significant differences among the groups (P-value for one-way ANOVA=0.892). Bars represent the standard error of the mean. (B) Scatter plot and linear regression analysis for hemoglobin concentration and hookworm EPG. The data of the children on the Pemba island in 2009 were used. P-value for coefficient was 0.968.

